Map
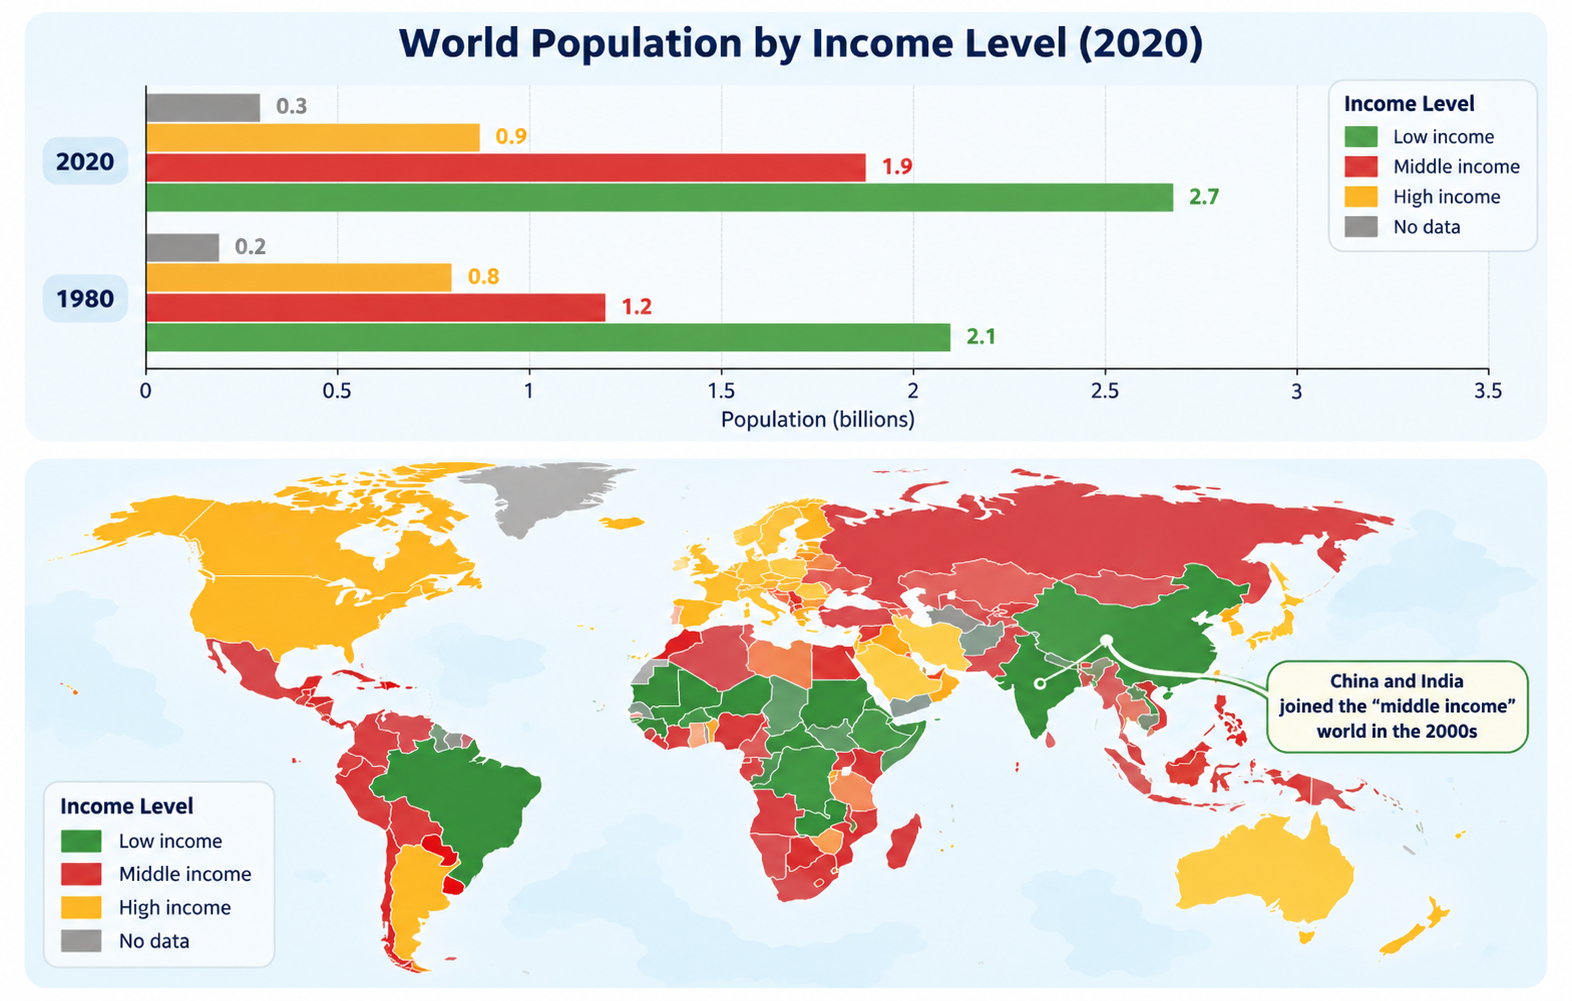
World Population by Income Level (1980 vs 2020)
Prep: 25s
Record: 40s
Look at the image below. In 25 seconds, please speak into the microphone and describe in detail what the image is showing. You will have 40 seconds to give your response.
Sample Answer & Key Features
Review official key features and a band-9 reference response
Key Points to Include in Your Description:
- 1Bar chart compares global population across four income categories (Low, Middle, High, No data) in 1980 and 2020 in billions.
- 2Low-income group remained the largest, expanding from 2.1 to 2.7 billion.
- 3Middle-income group grew significantly from 1.2 to 1.9 billion, with China and India joining the middle-income world in the 2000s.
- 4High-income category experienced modest growth from 0.8 to 0.9 billion.
- 5Map illustrates geographical distribution, highlighting high-income status in North America, Western Europe, and Australia.
- 6Overall figures reveal substantial global population growth concentrated in lower- and middle-income segments.