Describe Image Practice Bank
PTE CoreQuestion BankDescribe Image
PTE CORE SPEAKING TASK 3

Describe Image — Practice Bank (50 Exercises)

Study the image during the 25-second preparation period, then describe all main features, data points, trends, and conclusions in 40 seconds of clear speech.

50
Verified Items
25s / 40s
Prep / Record
25s silent prep + 40s recording window
Content, Pronunciation & Oral Fluency AI scoring
Verified sample answers & key points for each image
Showing 50 of 50 exercises

50 Verified Practice Exercises

All 50 exercises with high-res SVG visuals
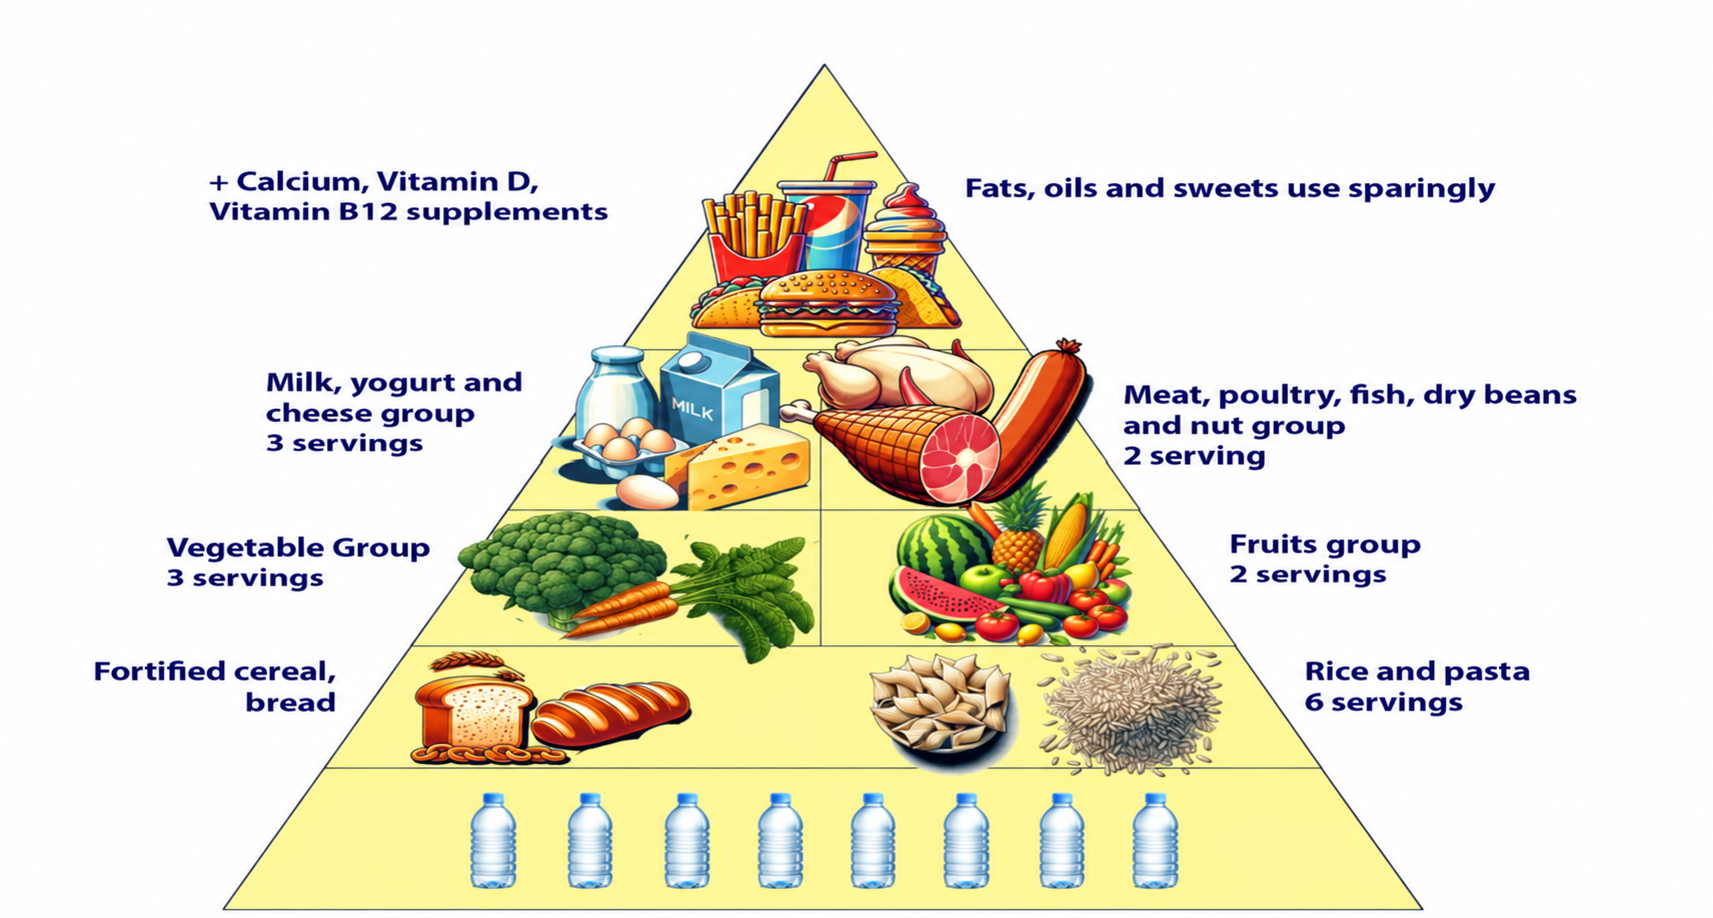
A food pyramid diagram showing how different food groups contribute to a balanced diet, with water at the foundation and fats, oils and sweets at the tip.
Process Diagram
DI-01

Food Pyramid & Daily Serving Guidelines

25s prep40s record
Key Highlight:

"Water forms the foundation of the pyramid."
Not attempted
Start Exercise
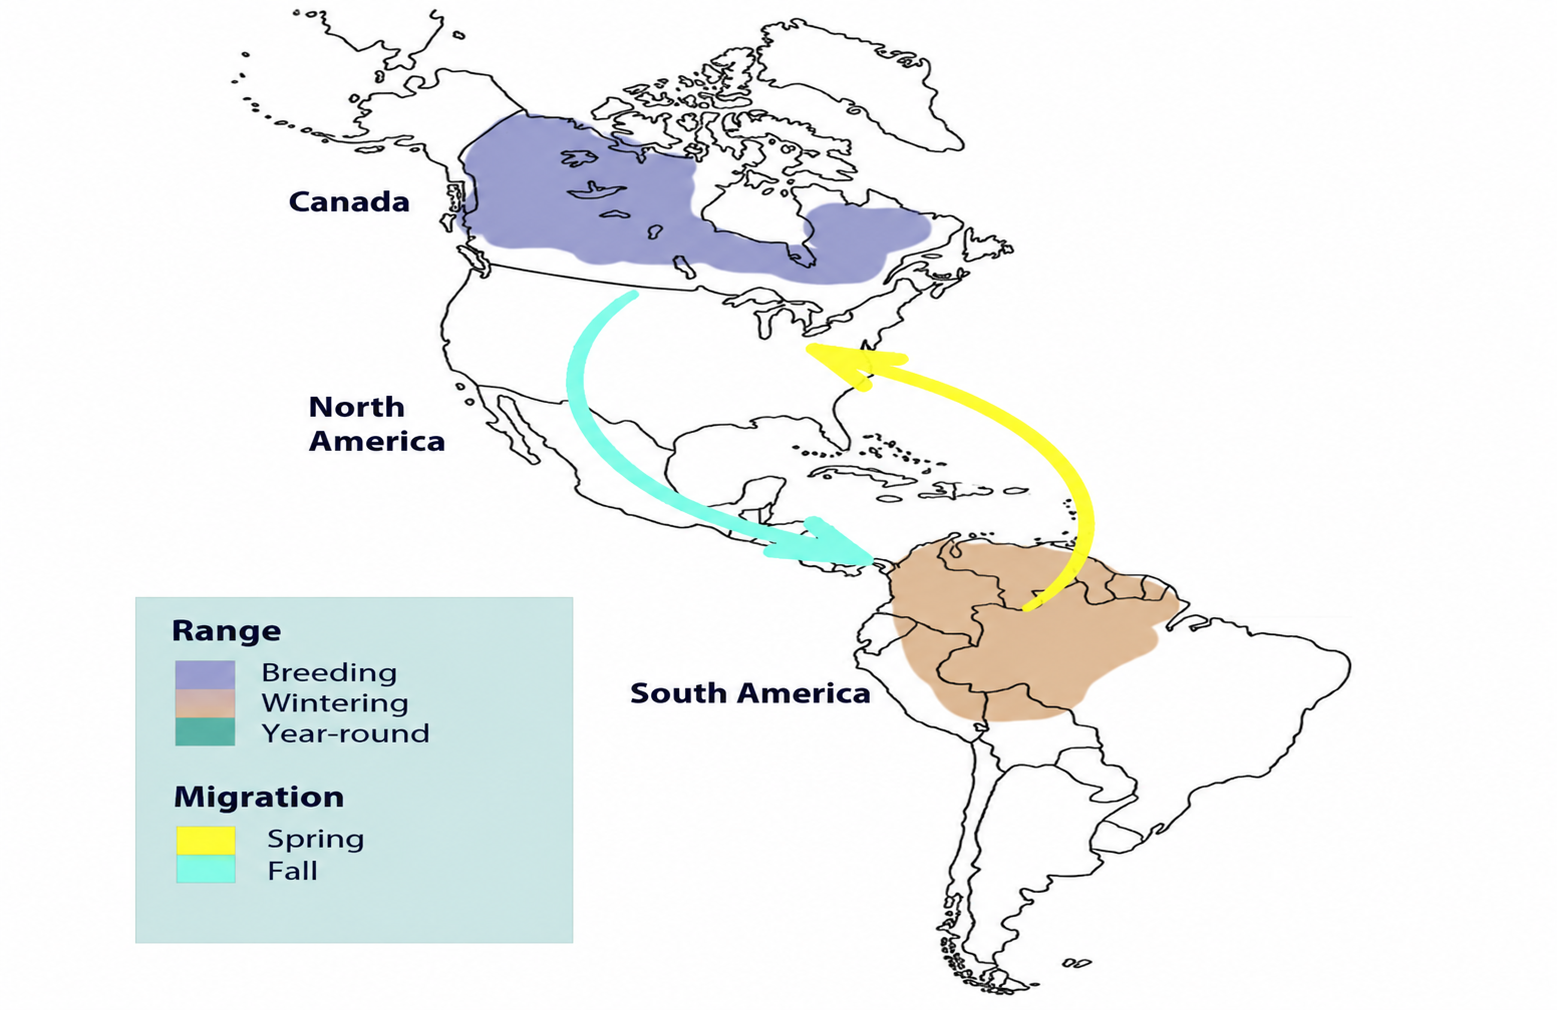
A migration map showing a species' seasonal movement between North and South America, with a purple breeding range in Canada, an orange wintering range in northern South America, and spring and fall migration arrows.
Map
DI-02

Seasonal Migration Routes (North & South America)

25s prep40s record
Key Highlight:

"Breeding range, shaded purple, stretches across much of Canada."
Not attempted
Start Exercise
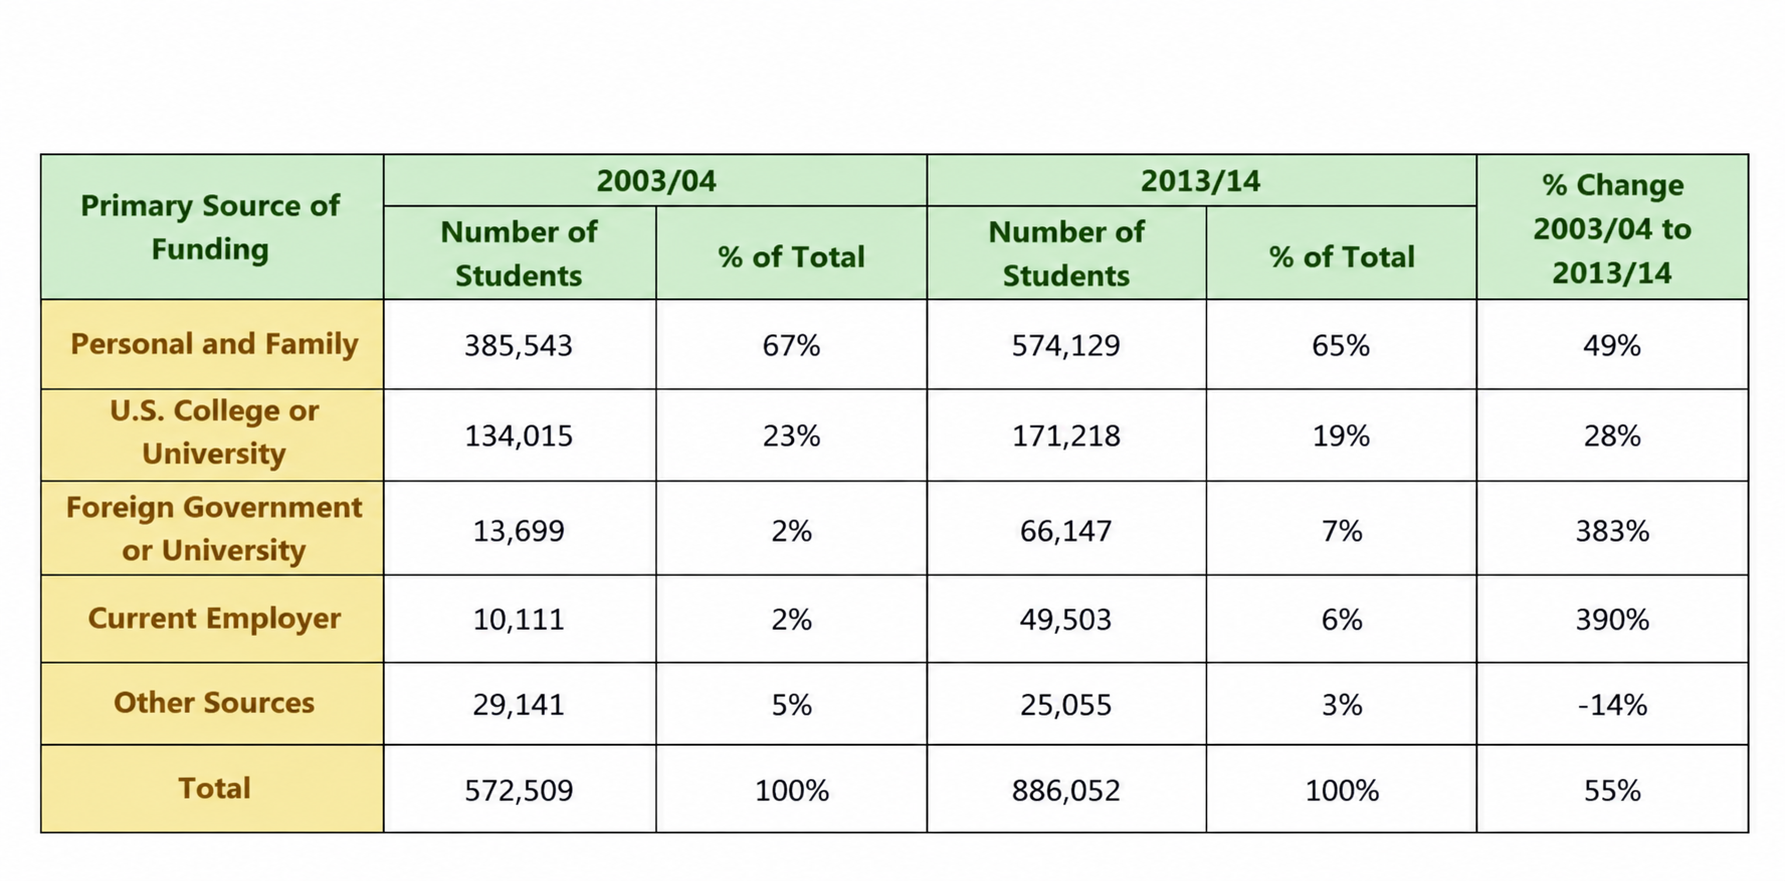
A table comparing students' primary sources of funding between academic years 2003/04 and 2013/14, detailing student counts, percentage shares, and ten-year percentage changes across funding categories.
Table
DI-03

Students' Primary Sources of Funding (2003/04 vs 2013/14)

25s prep40s record
Key Highlight:

"Personal and family funding remained dominant, though slipping from 67% to 65% of the total."
Not attempted
Start Exercise
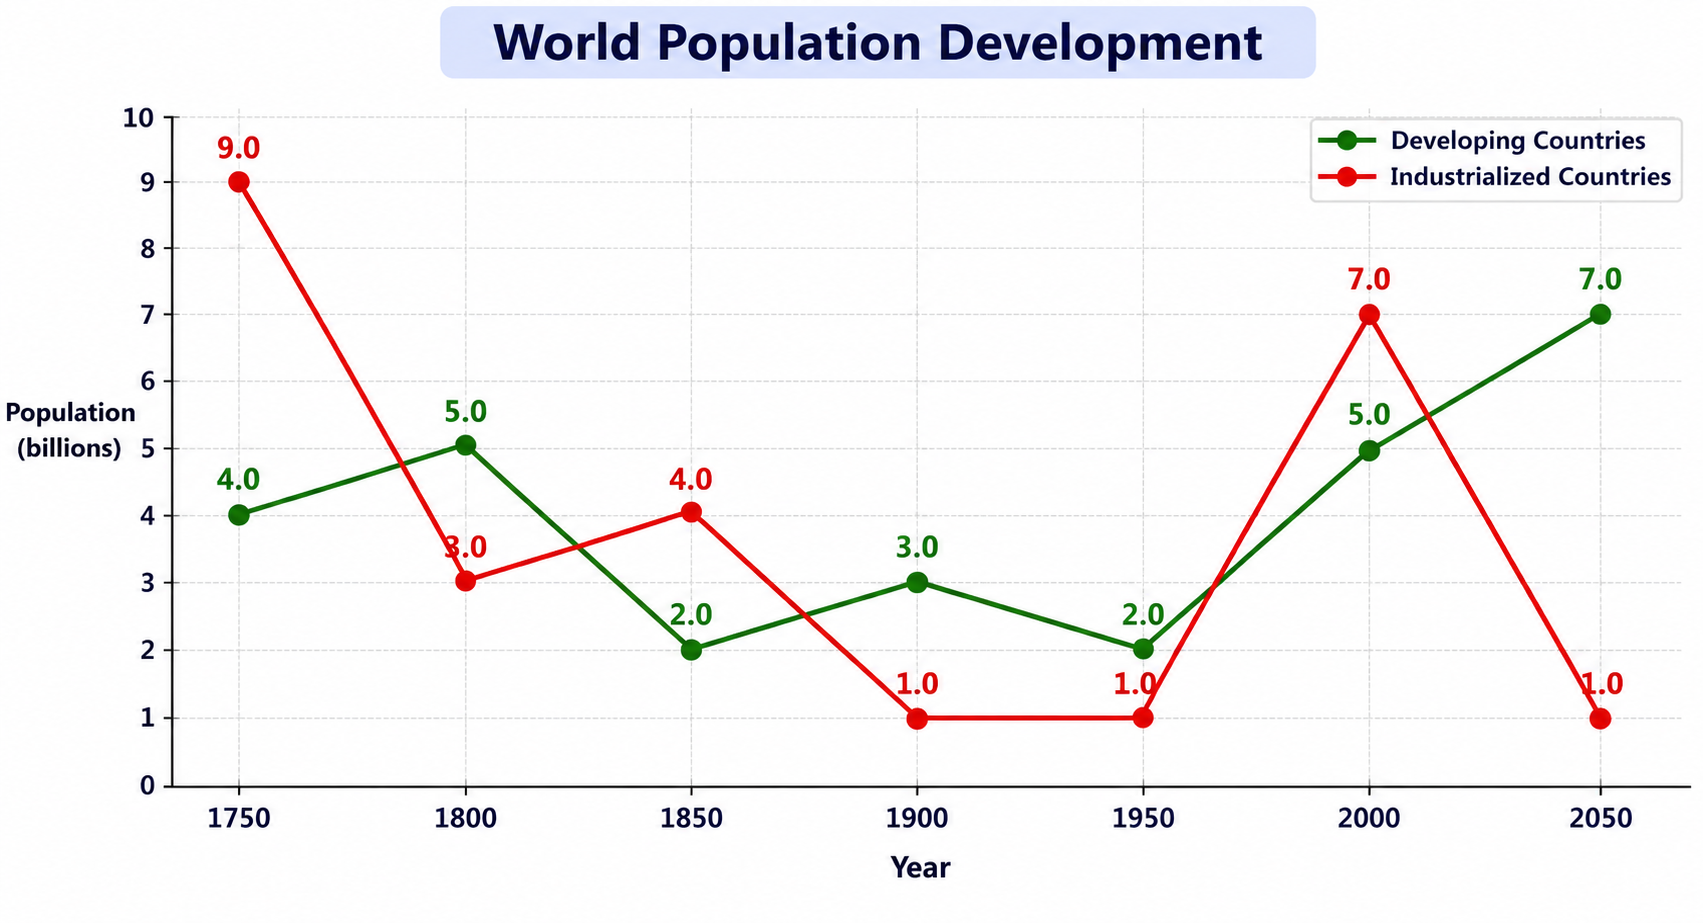
Line graph comparing world population development between developing and industrialized countries from 1750 to 2050, measured in billions.
Line Graph
DI-04

World Population Development (1750–2050)

25s prep40s record
Key Highlight:

"Compares population figures for developing and industrialized countries from 1750 to 2050 in billions."
Not attempted
Start Exercise
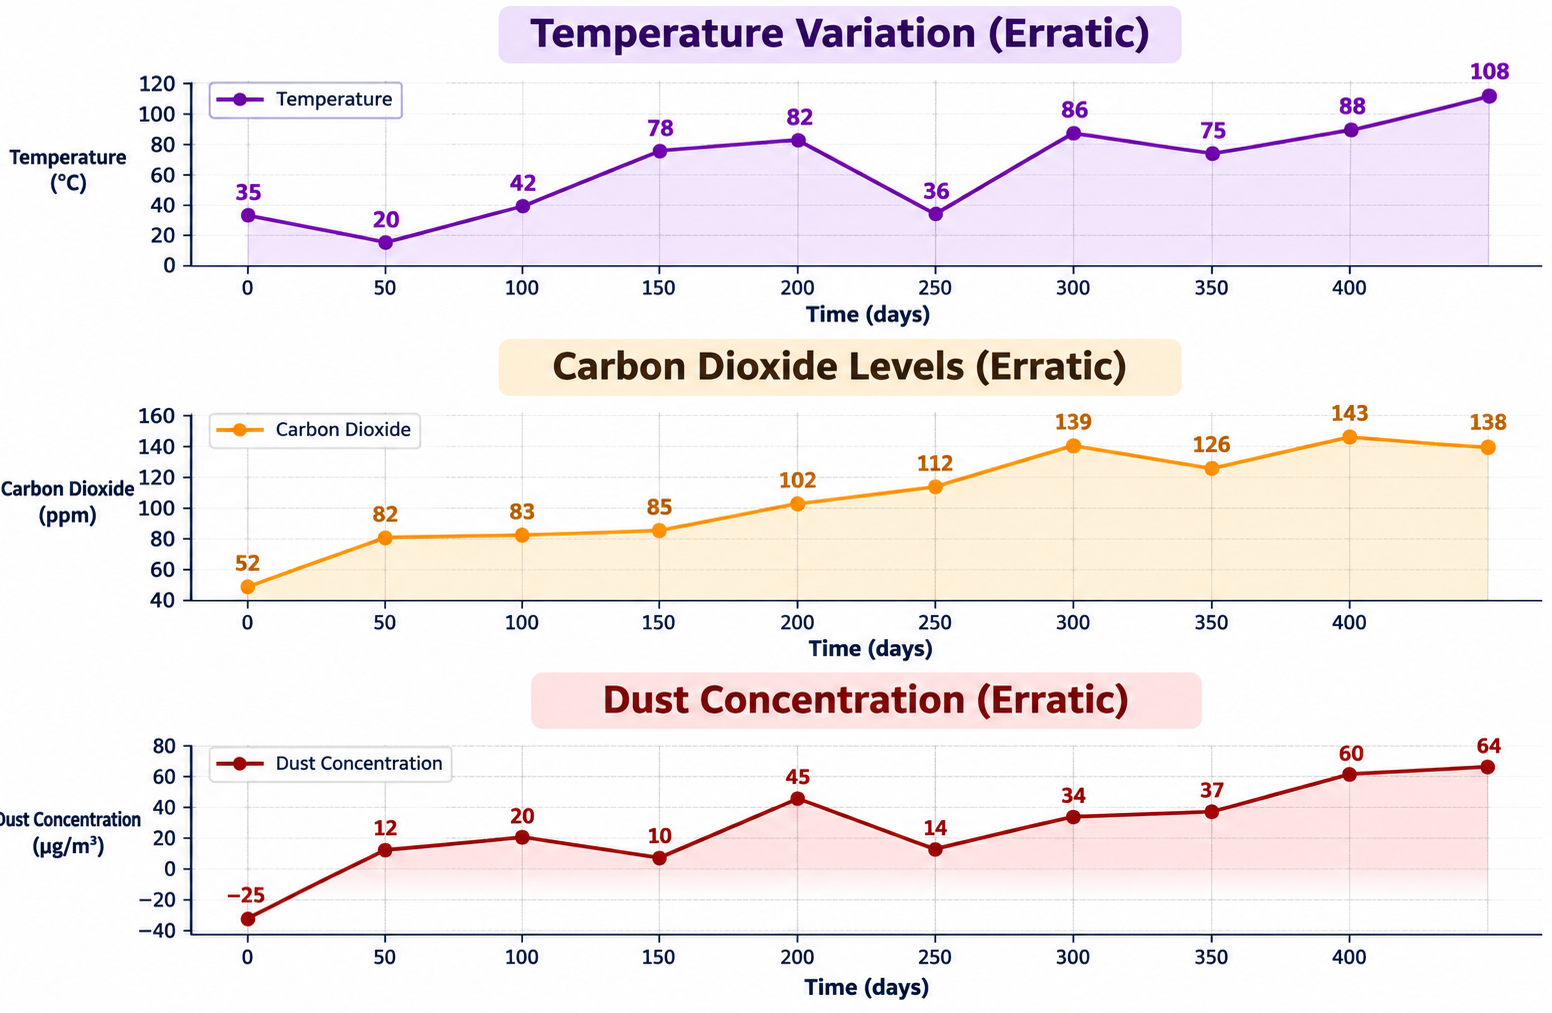
Three stacked line charts tracking erratic environmental trends over time in days: Temperature Variation (°C), Carbon Dioxide Levels (ppm), and Dust Concentration (µg/m³).
Line Graph
DI-05

Environmental Trends: Temperature, CO2 & Dust Concentration

25s prep40s record
Key Highlight:

"Three stacked line charts tracking temperature, carbon dioxide levels, and dust concentration over a 450-day period."
Not attempted
Start Exercise
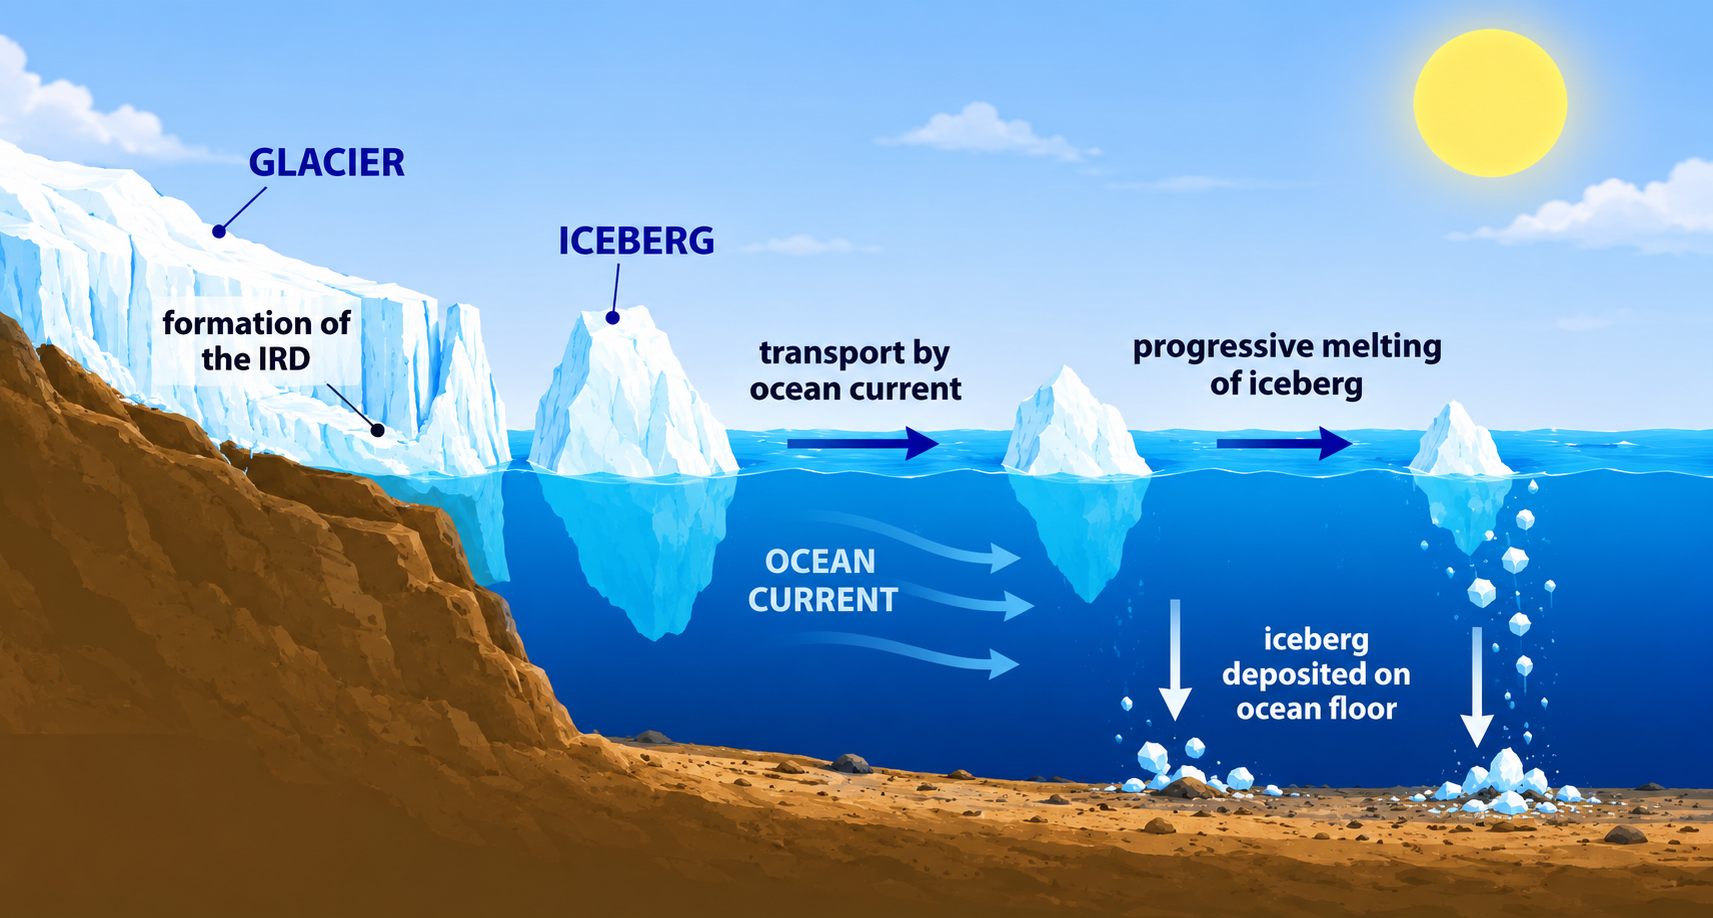
Process diagram illustrating an iceberg's journey from a glacier cliff into the ocean, showing formation, transport by ocean current, progressive melting, and deposition on the seabed.
Process Diagram
DI-06

Iceberg Journey: From Glacier to Ocean Deposition

25s prep40s record
Key Highlight:

"Large mass of ice breaks away from the glacier and floats offshore, mostly submerged."
Not attempted
Start Exercise
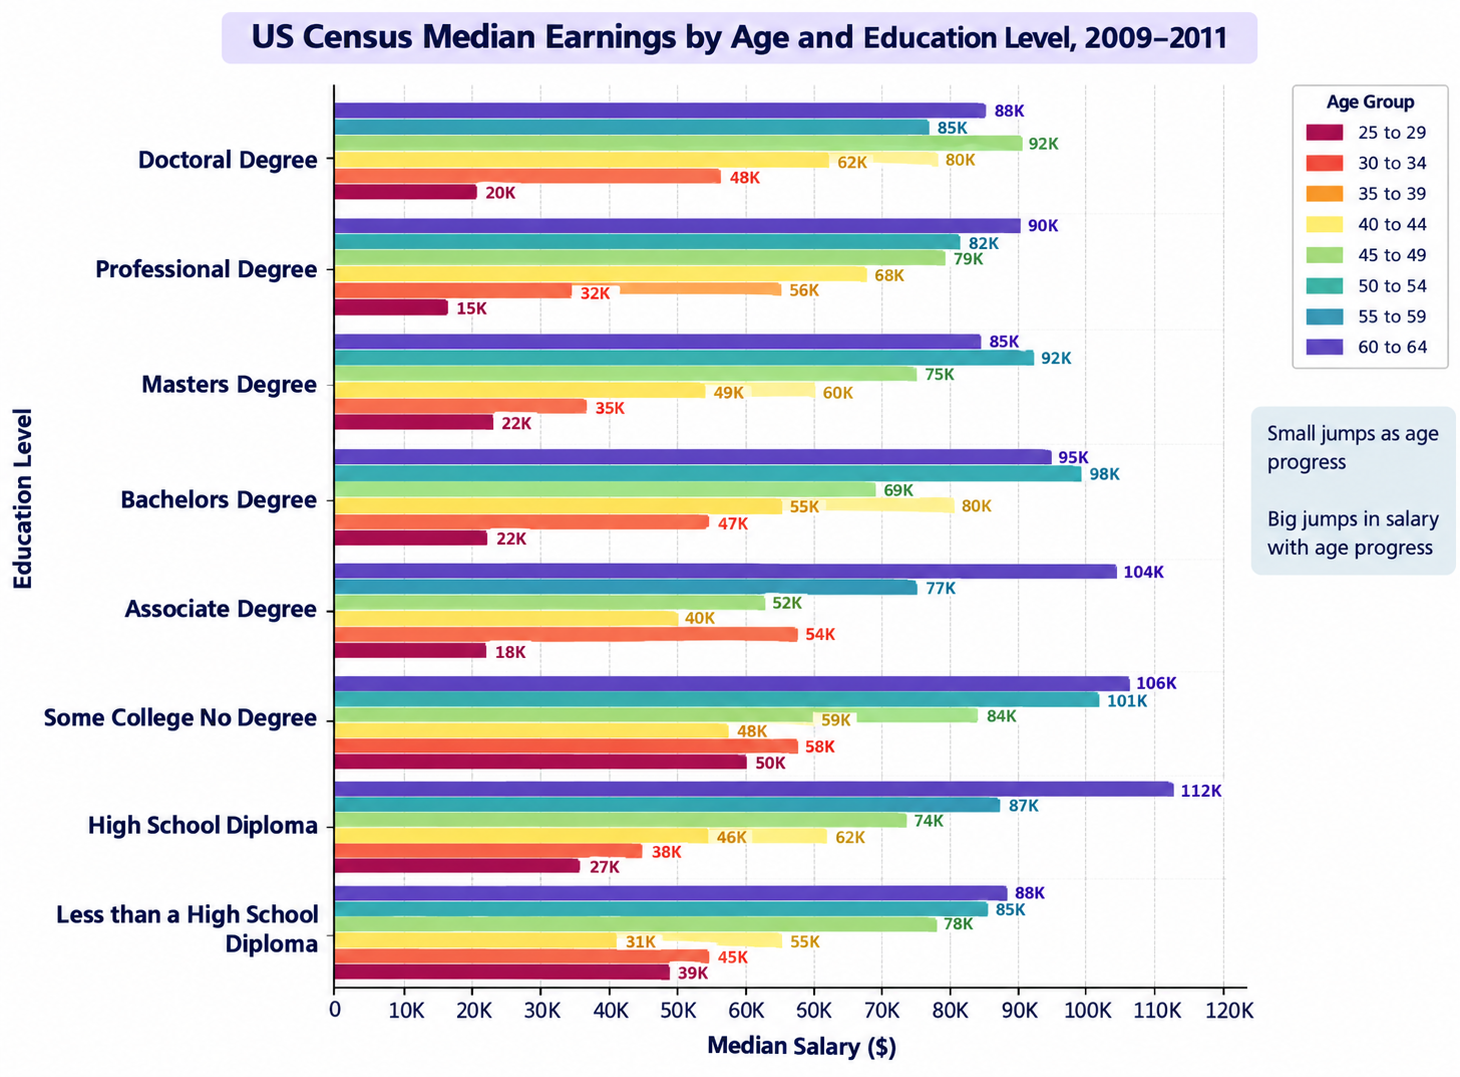
Horizontal grouped bar chart showing US Census median earnings across eight education levels and eight age groups ranging from 25 to 64 years old between 2009 and 2011.
Bar Chart
DI-07

US Census Median Earnings by Age and Education Level (2009–2011)

25s prep40s record
Key Highlight:

"Compares median earnings across age groups (25–29 up to 60–64) and eight education levels between 2009 and 2011."
Not attempted
Start Exercise
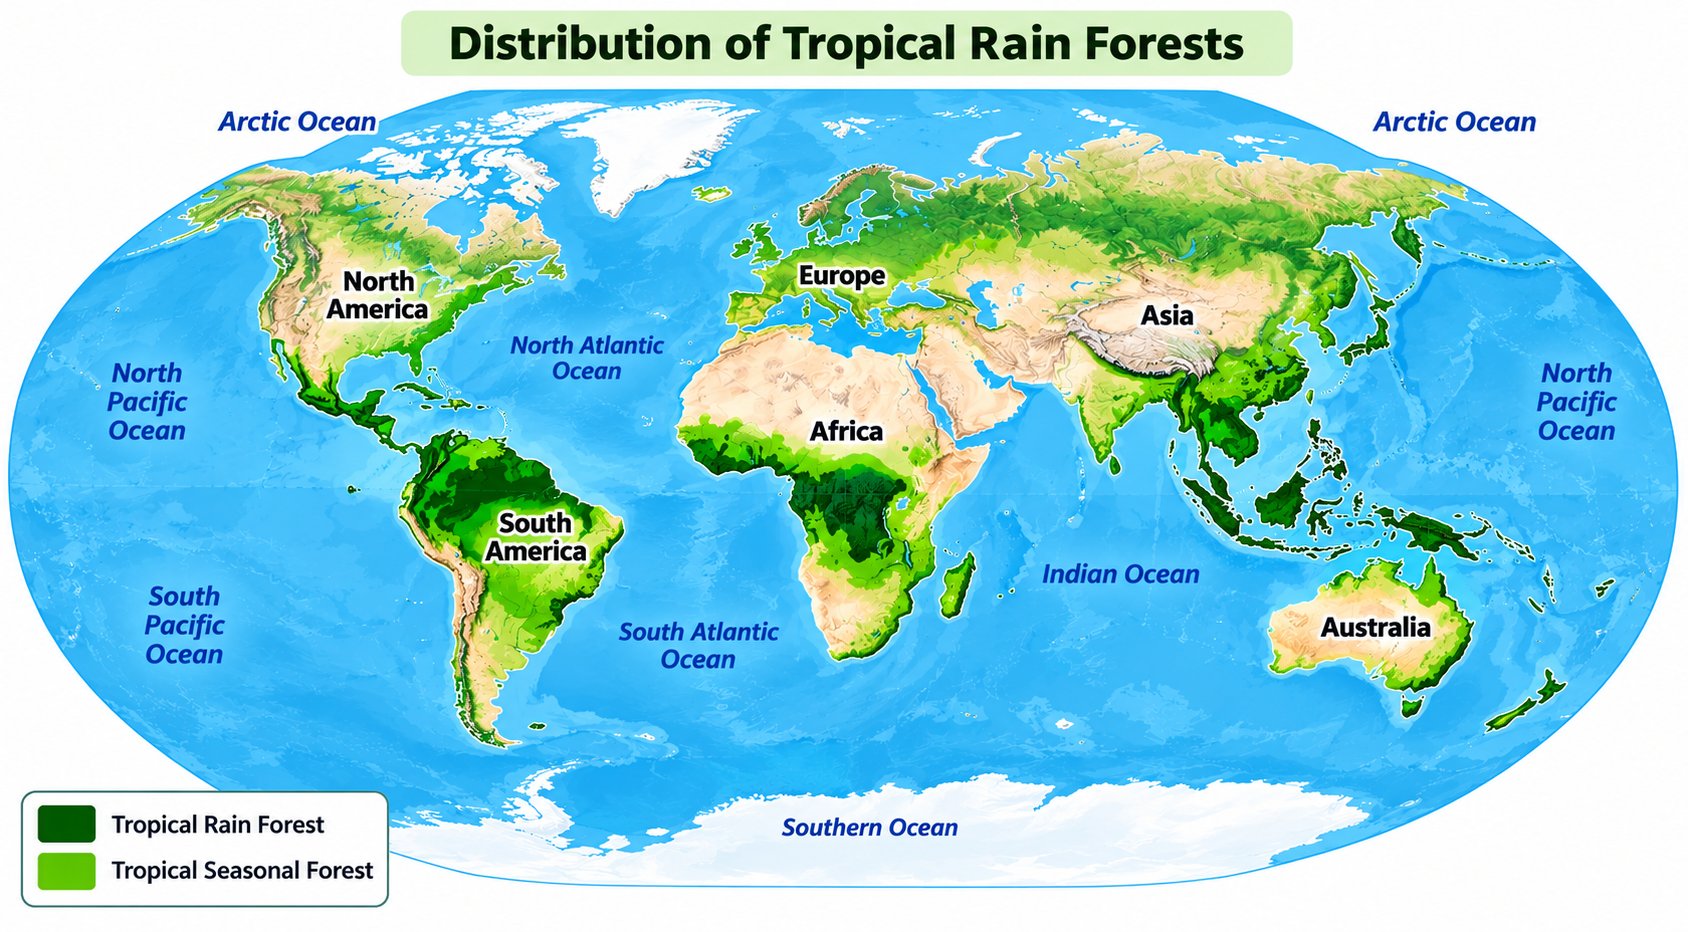
A world map illustrating the global distribution of tropical rain forests (dark green) and tropical seasonal forests (light green) forming an equatorial belt across South America, Africa, and Southeast Asia.
Map
DI-08

Distribution of Tropical Rain Forests

25s prep40s record
Key Highlight:

"Illustrates distribution of tropical rainforests (dark green) and seasonal forests (light green)."
Not attempted
Start Exercise
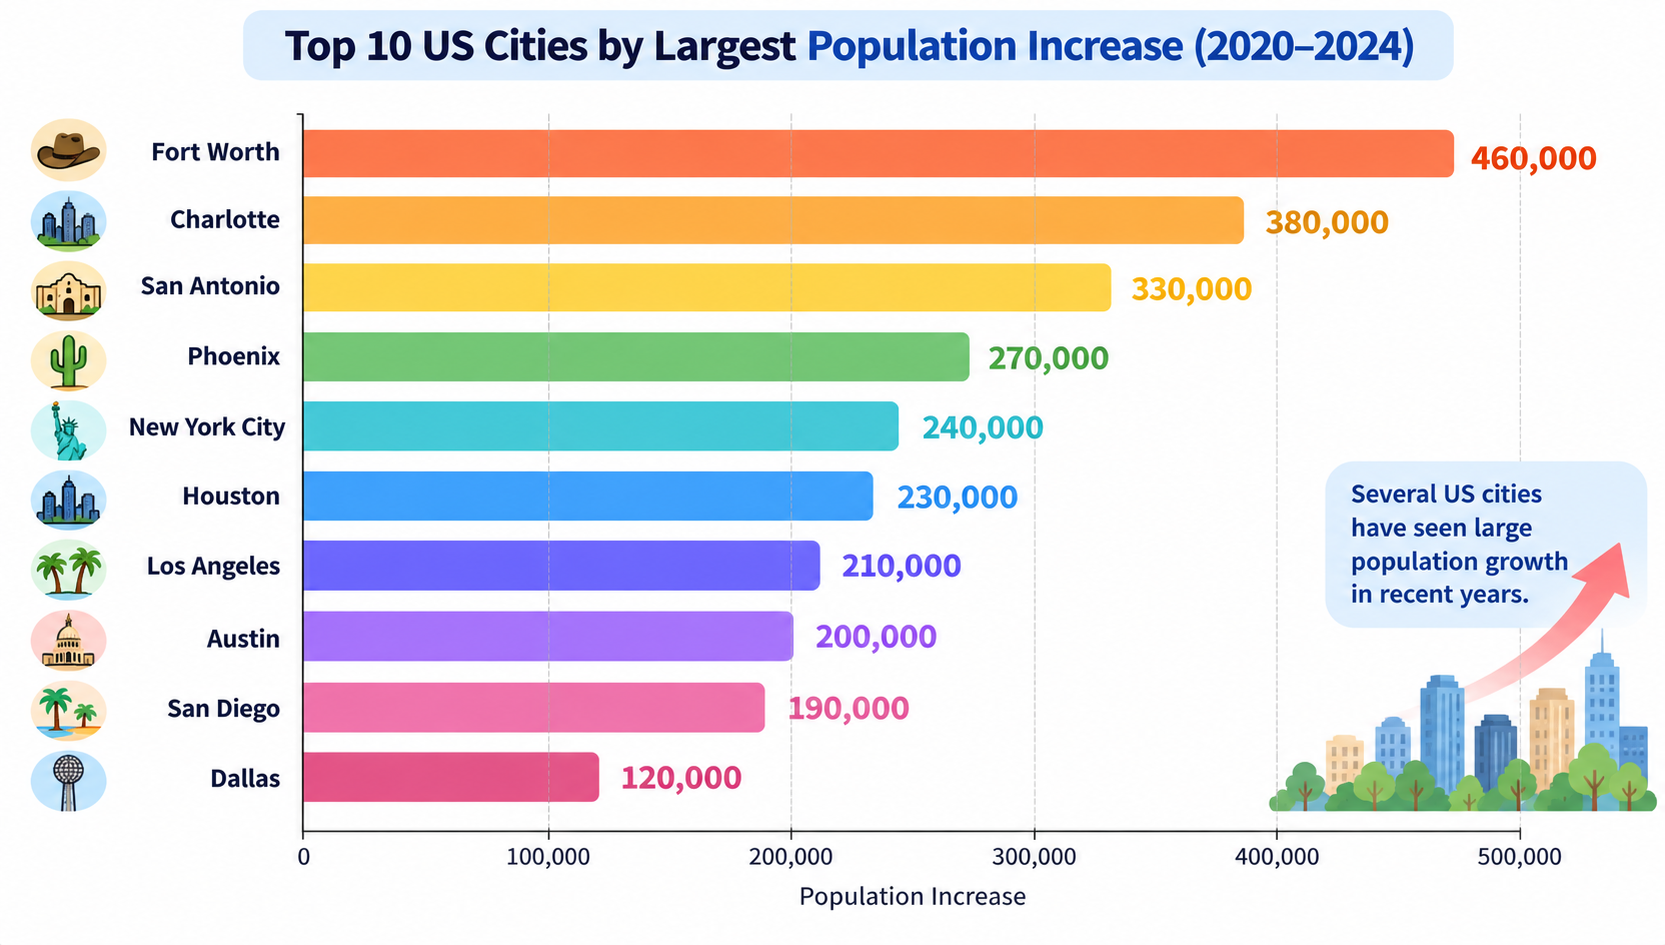
Horizontal bar chart ranking the top 10 US cities by largest population increase between 2020 and 2024, led by Fort Worth at 460,000 down to Dallas at 120,000.
Bar Chart
DI-09

Top 10 US Cities by Largest Population Increase (2020–2024)

25s prep40s record
Key Highlight:

"Ranks top ten U.S. cities by population increase between 2020 and 2024."
Not attempted
Start Exercise
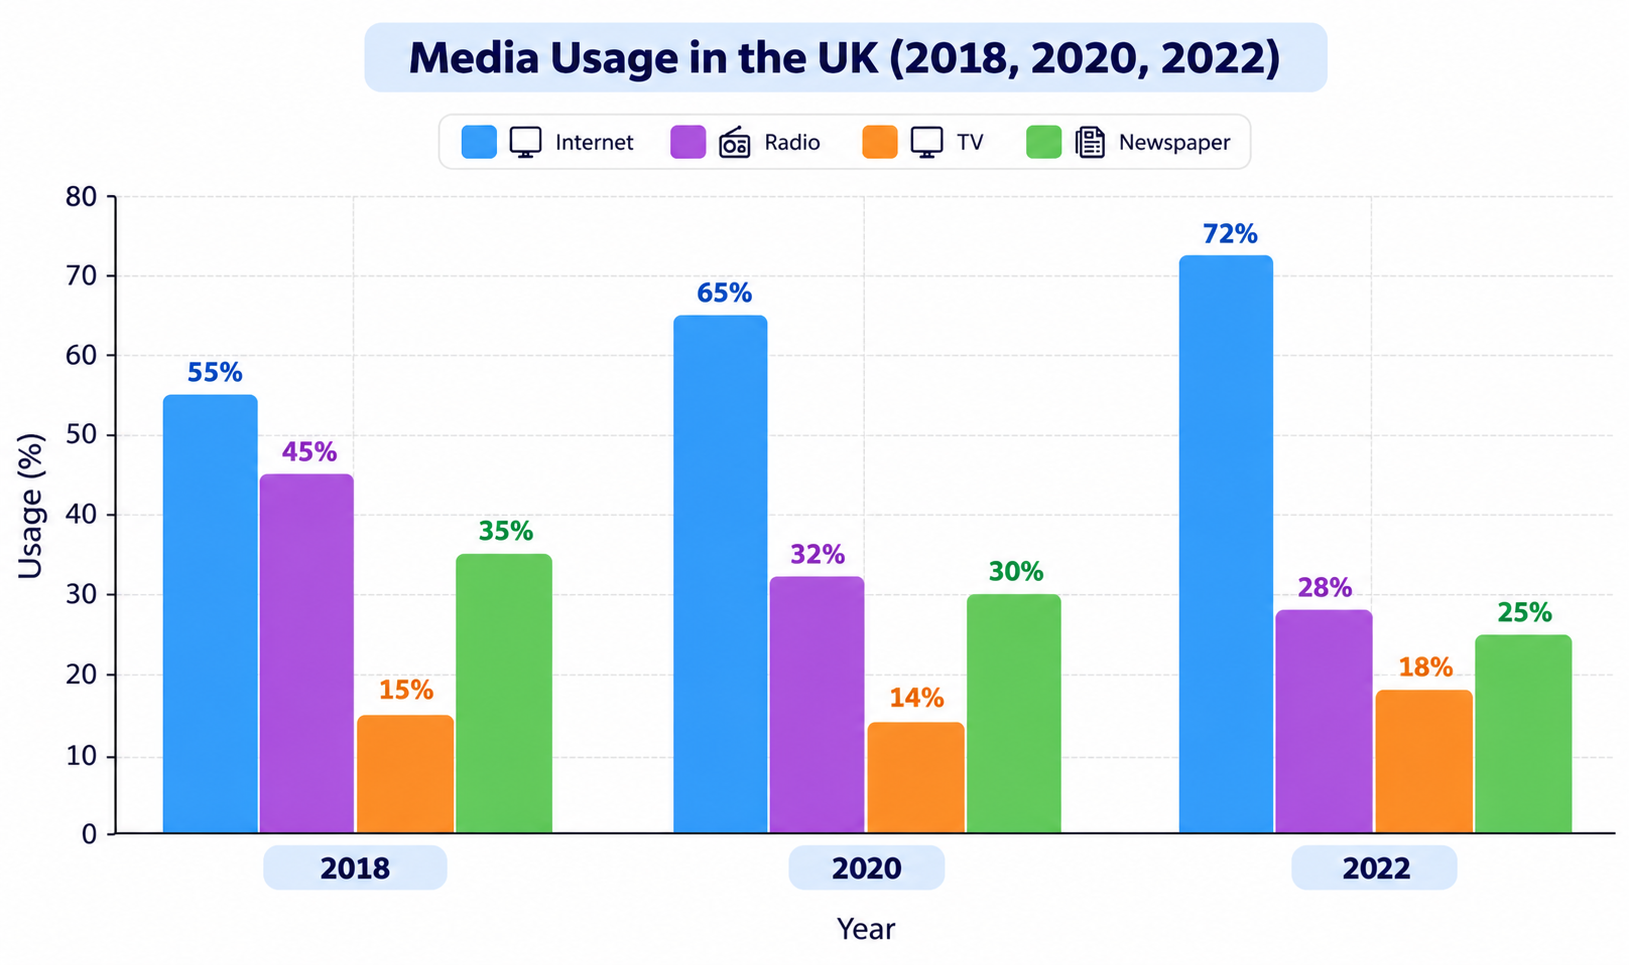
Grouped bar chart showing media usage percentages in the UK for 2018, 2020, and 2022 across Internet, Radio, TV, and Newspaper.
Bar Chart
DI-10

Media Usage in the UK (2018, 2020, 2022)

25s prep40s record
Key Highlight:

"Compares four media types in the UK across 2018, 2020, and 2022."
Not attempted
Start Exercise
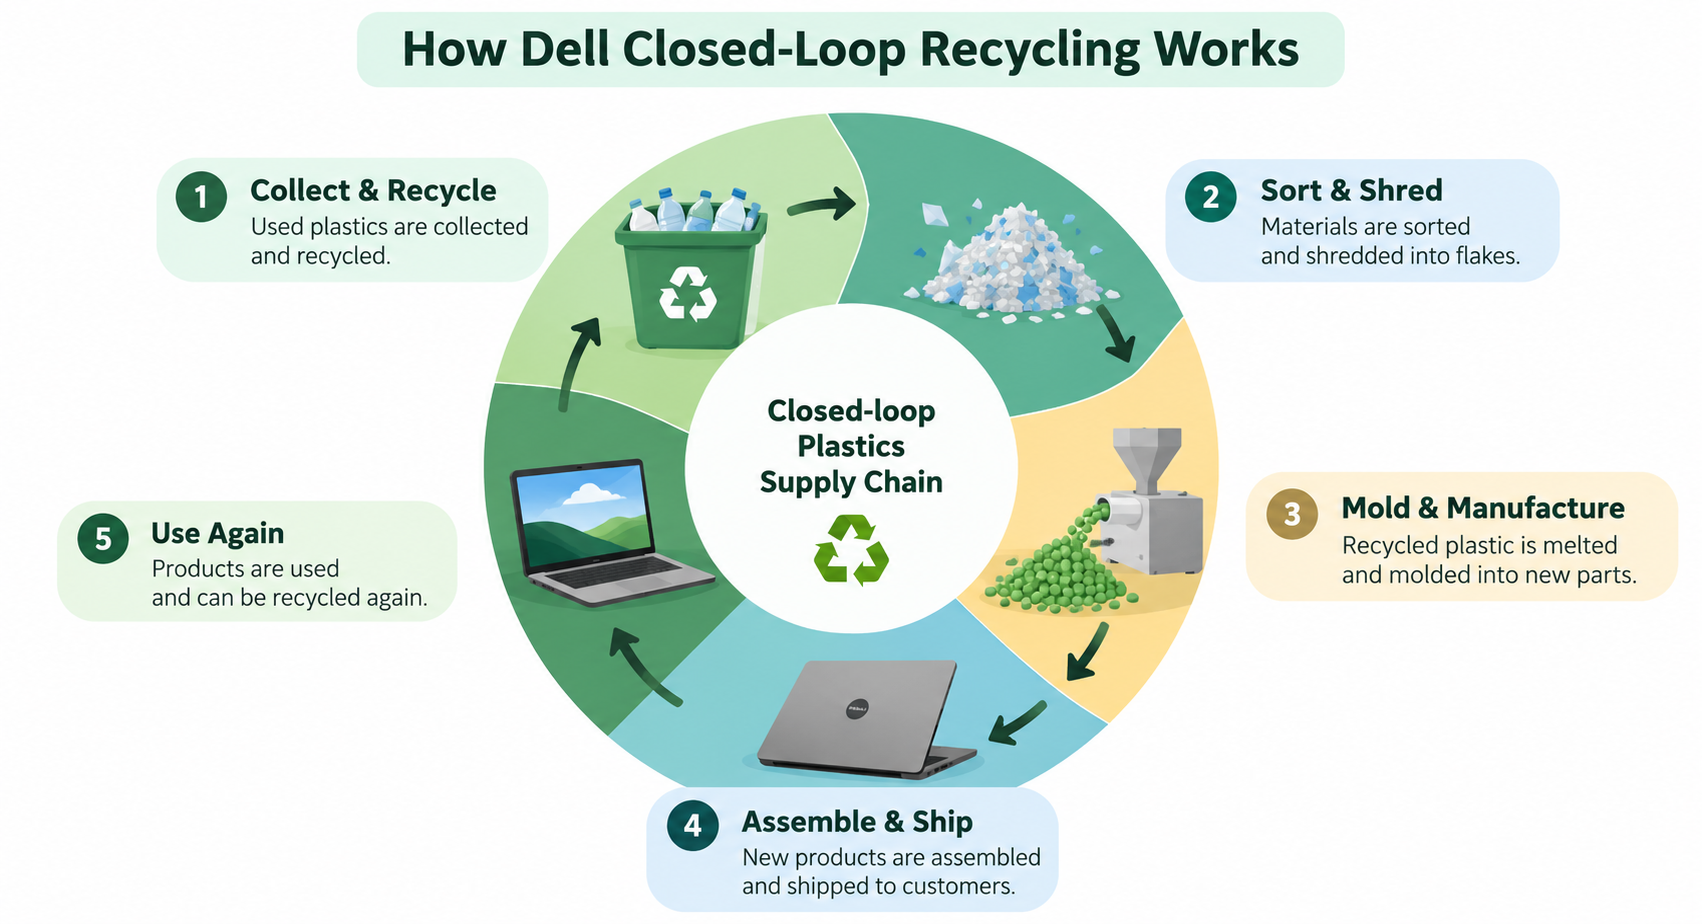
Diagram illustrating Dell's closed-loop plastics supply chain across five stages: Collect & Recycle, Sort & Shred, Mold & Manufacture, Assemble & Ship, and Use Again.
Process Diagram
DI-11

How Dell Closed-Loop Recycling Works

25s prep40s record
Key Highlight:

"Dell's closed-loop recycling process turns used plastics into new products across five connected stages."
Not attempted
Start Exercise
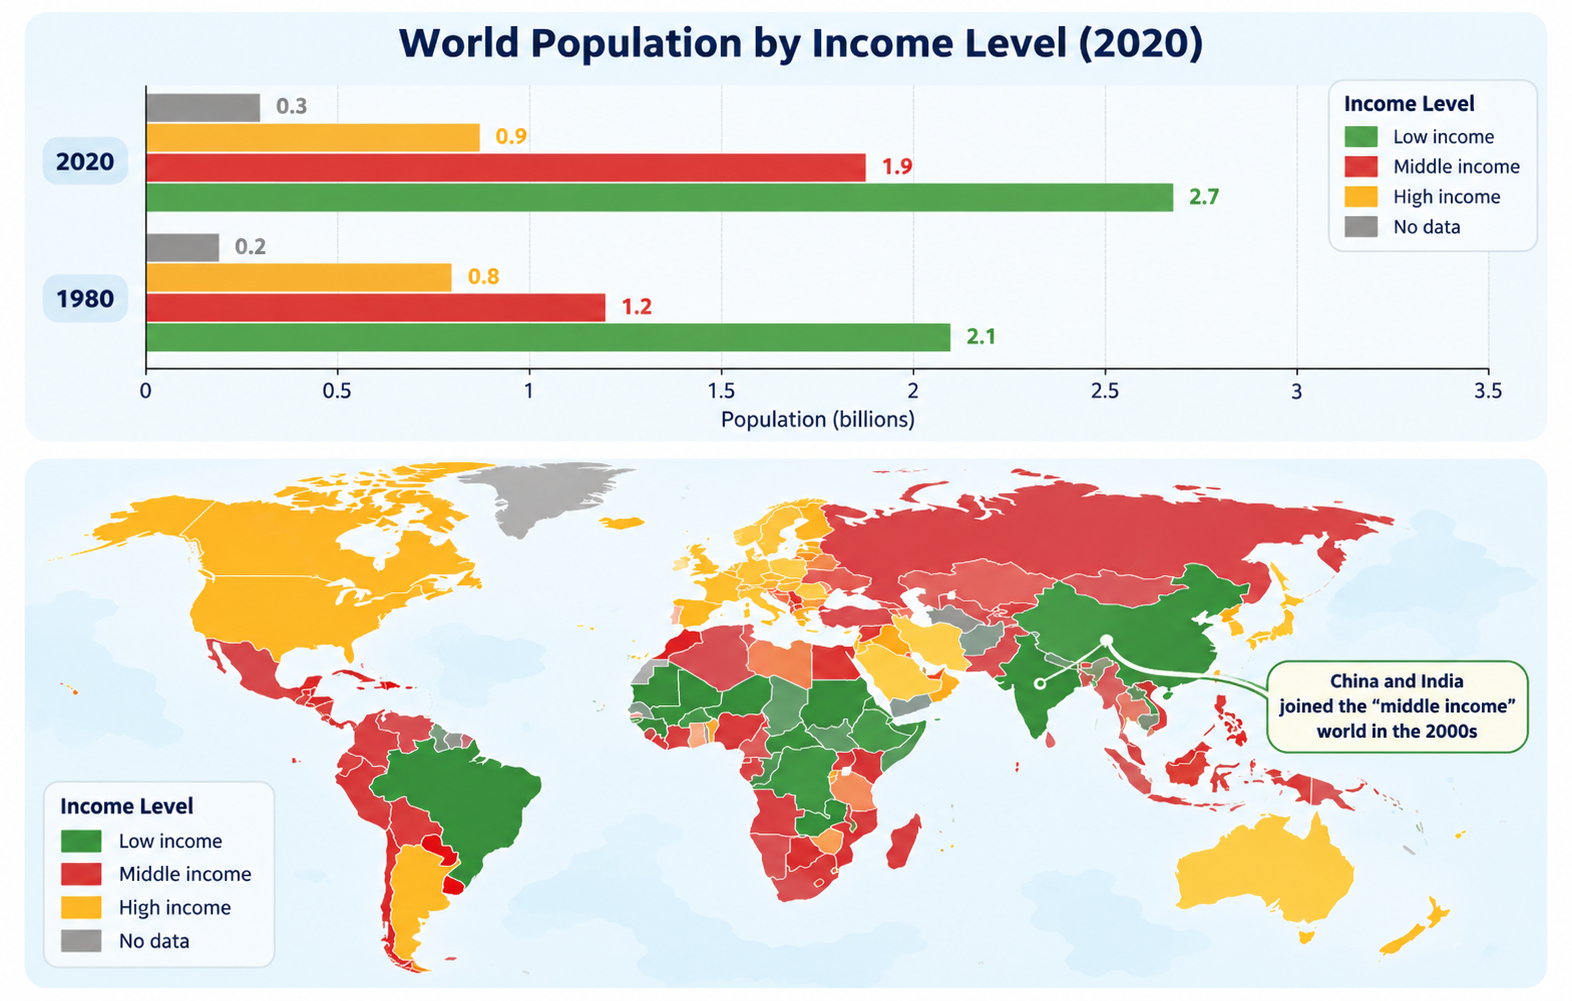
Infographic showing a horizontal bar chart of World Population by Income Level in 1980 and 2020 alongside a global map of income levels showing geographic distribution across low, middle, and high income groups.
Map
DI-12

World Population by Income Level (1980 vs 2020)

25s prep40s record
Key Highlight:

"Bar chart compares global population across four income categories (Low, Middle, High, No data) in 1980 and 2020 in billions."

Not attempted
Start Exercise
Flowchart titled 'Beginning of flow chart for QUIZ' showing quiz navigation from Slide 1 (start quiz) to Slide 2 (Question 1), branching to Click True leading to Slide 4 (Wrong) or Click False leading to Slide 5 (Correct) and onward to Question 2.
Process Diagram
DI-13

Beginning of Flowchart for Quiz

25s prep40s record
Key Highlight:

"Process begins on Slide 1 with starting the quiz."
Not attempted
Start Exercise
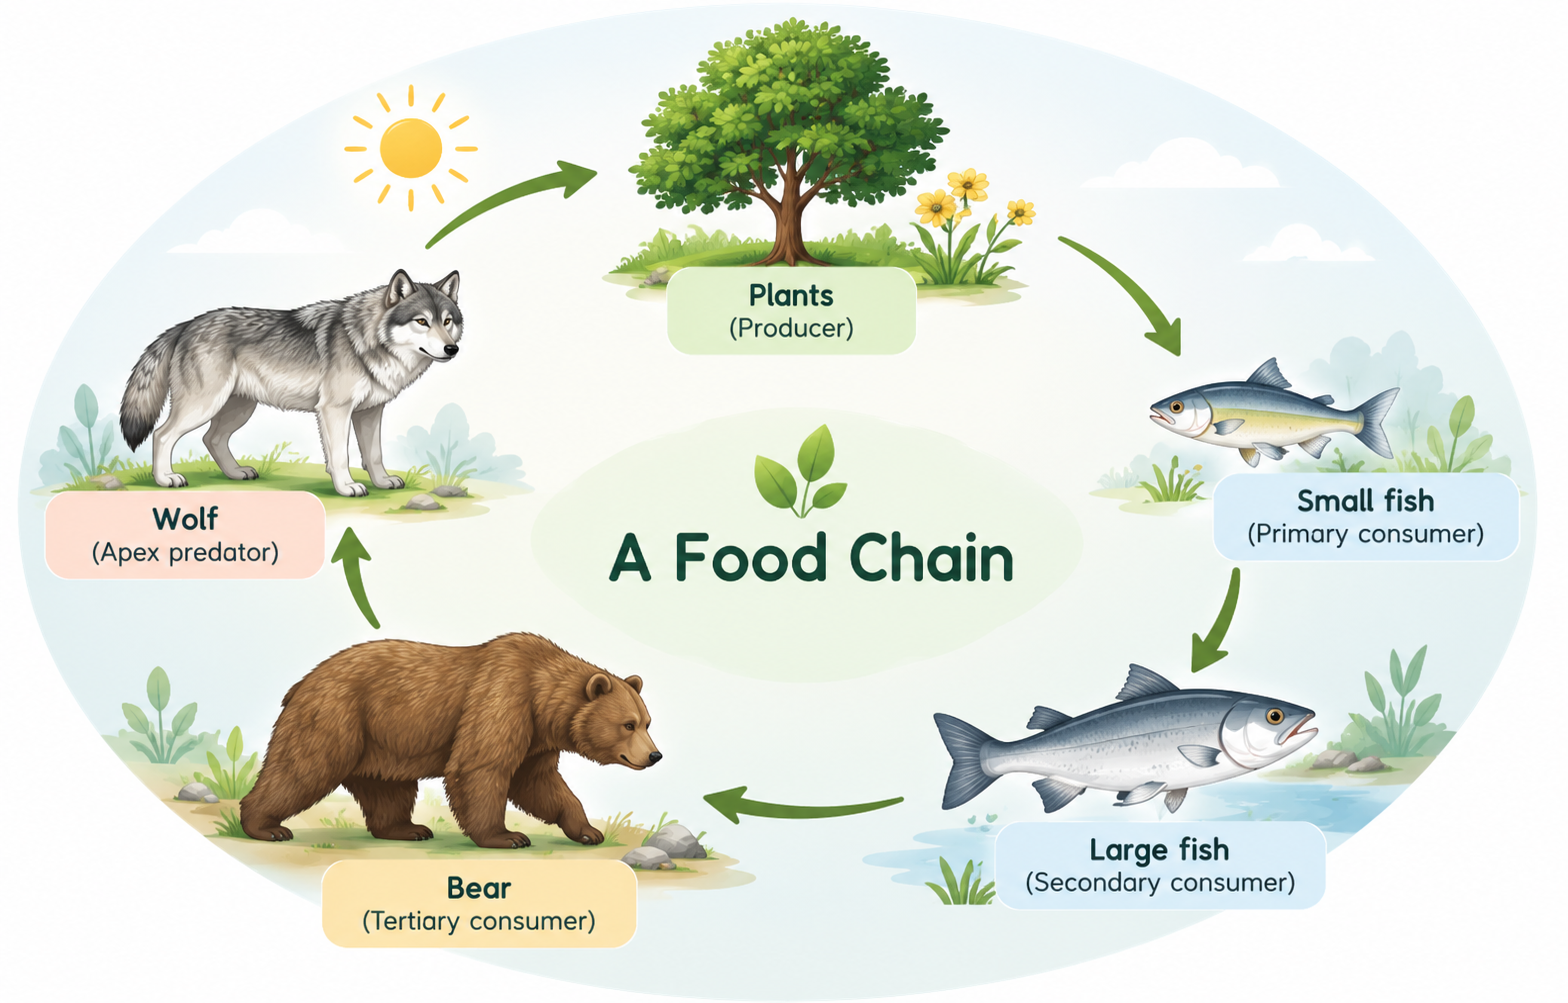
A circular diagram titled 'A Food Chain' illustrating energy flow across five trophic levels: Plants (Producer), Small fish (Primary consumer), Large fish (Secondary consumer), Bear (Tertiary consumer), and Wolf (Apex predator), with connecting green arrows.
Process Diagram
DI-14

A Food Chain: Energy Flow in an Ecosystem

25s prep40s record
Key Highlight:

"Process begins with plants, which act as producers by converting sunlight into energy."
Not attempted
Start Exercise
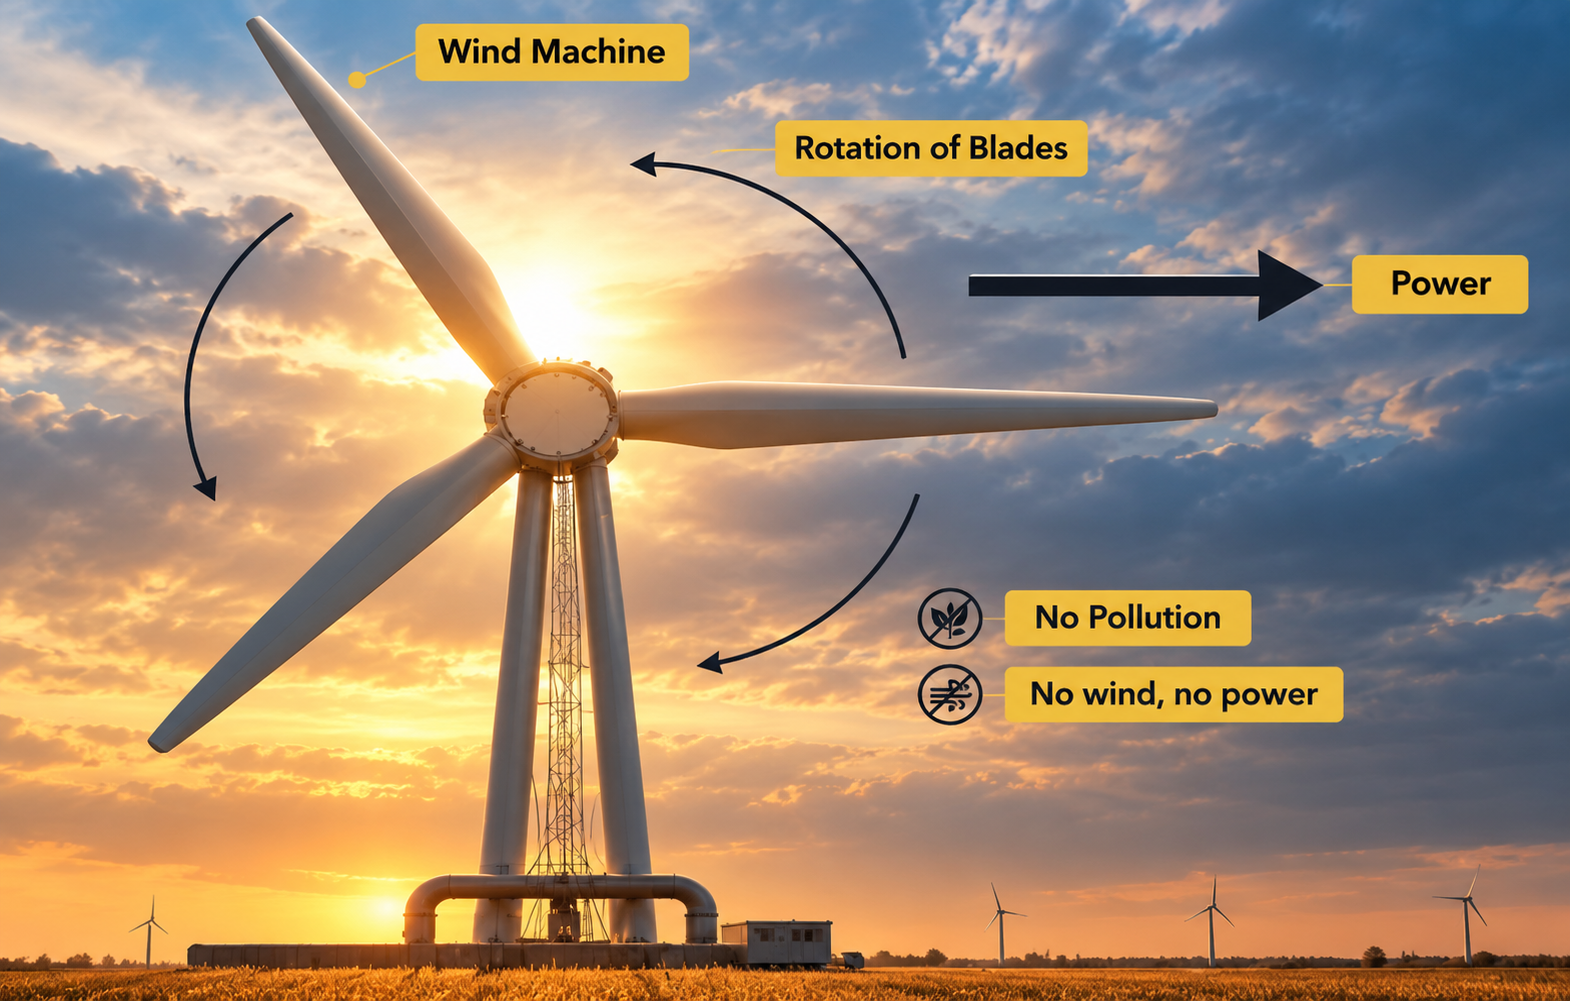
Infographic illustration of a large wind machine turbine against a sunset sky, with labels showing rotation of blades, power generation arrow, 'No Pollution', and 'No wind, no power'.
Process Diagram
DI-15

Wind Machine: Renewable Energy Generation

25s prep40s record
Key Highlight:

"Large turbine at the centre features three rotating blades capturing wind energy."
Not attempted
Start Exercise
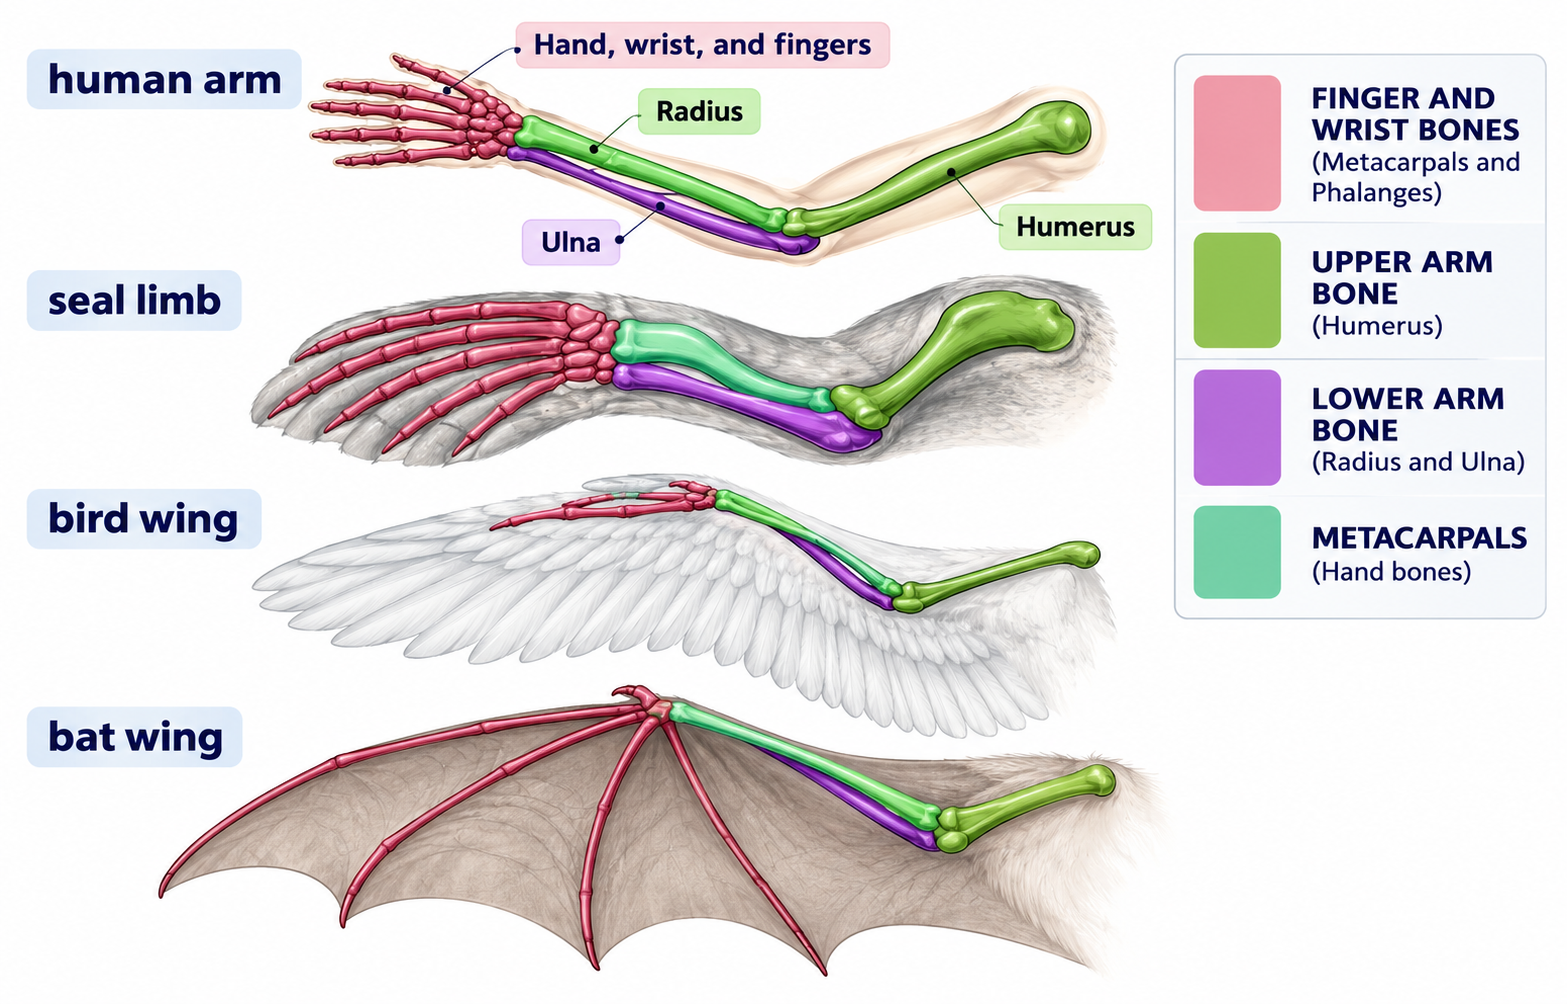
Anatomical diagram comparing the skeletal structures of four homologous forelimbs — human arm, seal limb/flipper, bird wing, and bat wing — color-coded by bone groups: humerus, radius and ulna, carpals, and phalanges.
Process Diagram
DI-16

Homologous Forelimbs Across Species

25s prep40s record
Key Highlight:

"Compares skeletal structures of four forelimbs: human arm, seal limb, bird wing, and bat wing."
Not attempted
Start Exercise
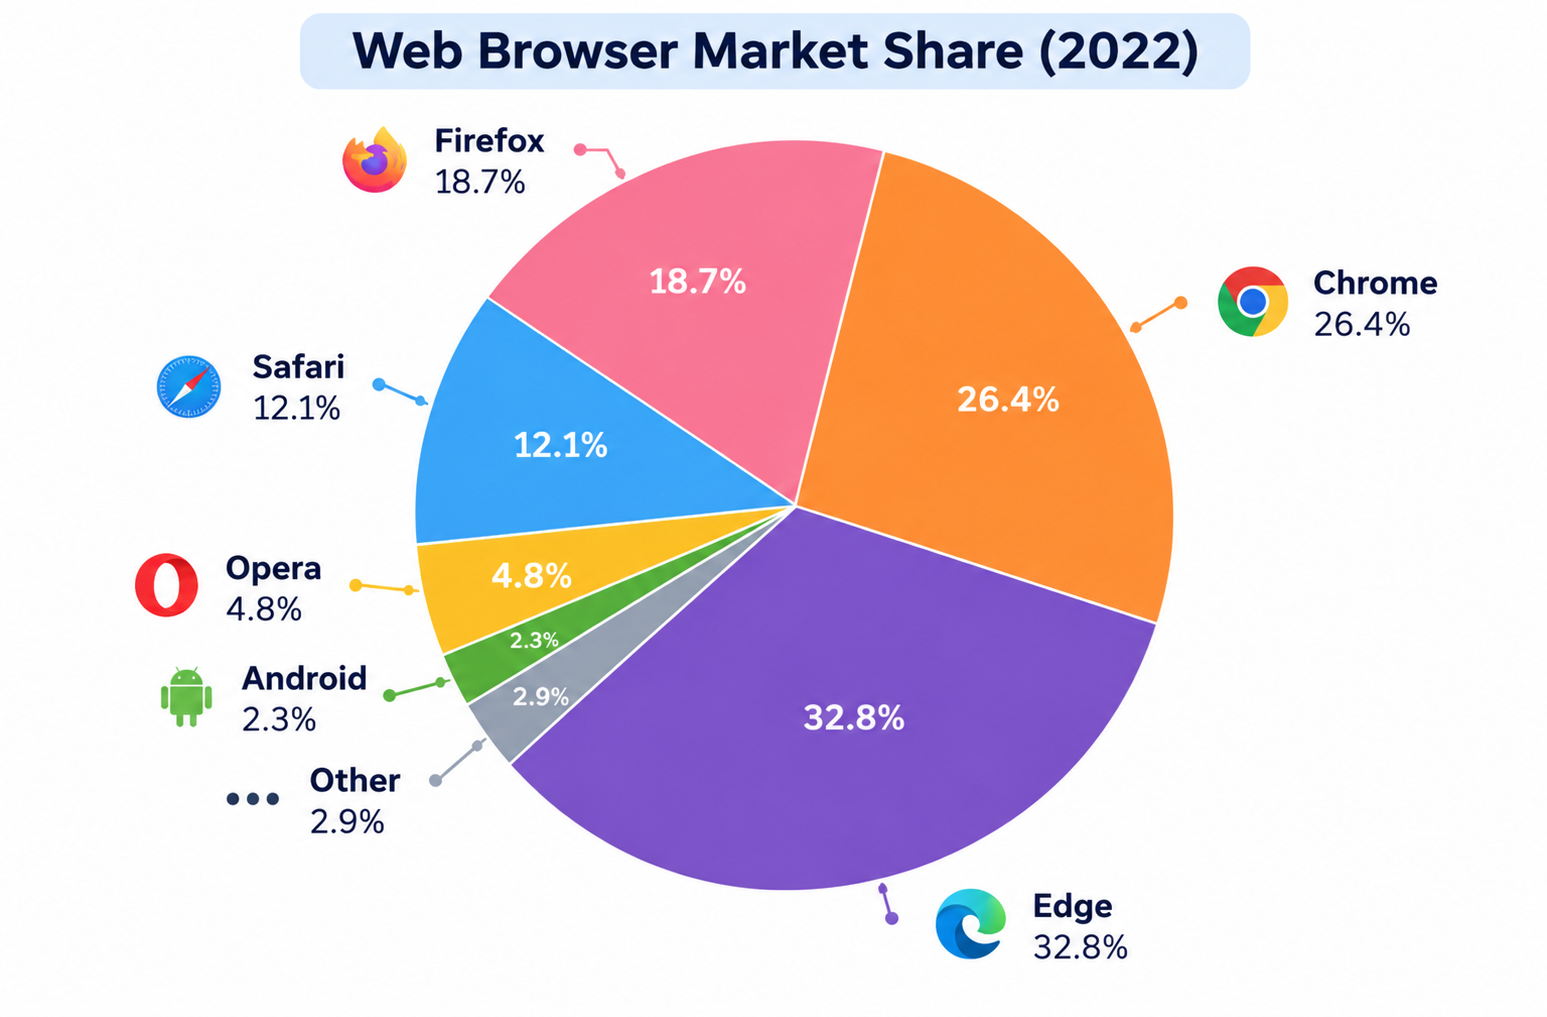
A pie chart titled 'Web Browser Market Share (2022)' showing market shares: Microsoft Edge at 32.8%, Chrome at 26.4%, Firefox at 18.7%, Safari at 12.1%, Opera at 4.8%, Android at 2.3%, and Other at 2.9%.
Pie Chart
DI-17

Web Browser Market Share (2022)

25s prep40s record
Key Highlight:

"Microsoft Edge dominated the market in 2022, accounting for 32.8%."
Not attempted
Start Exercise
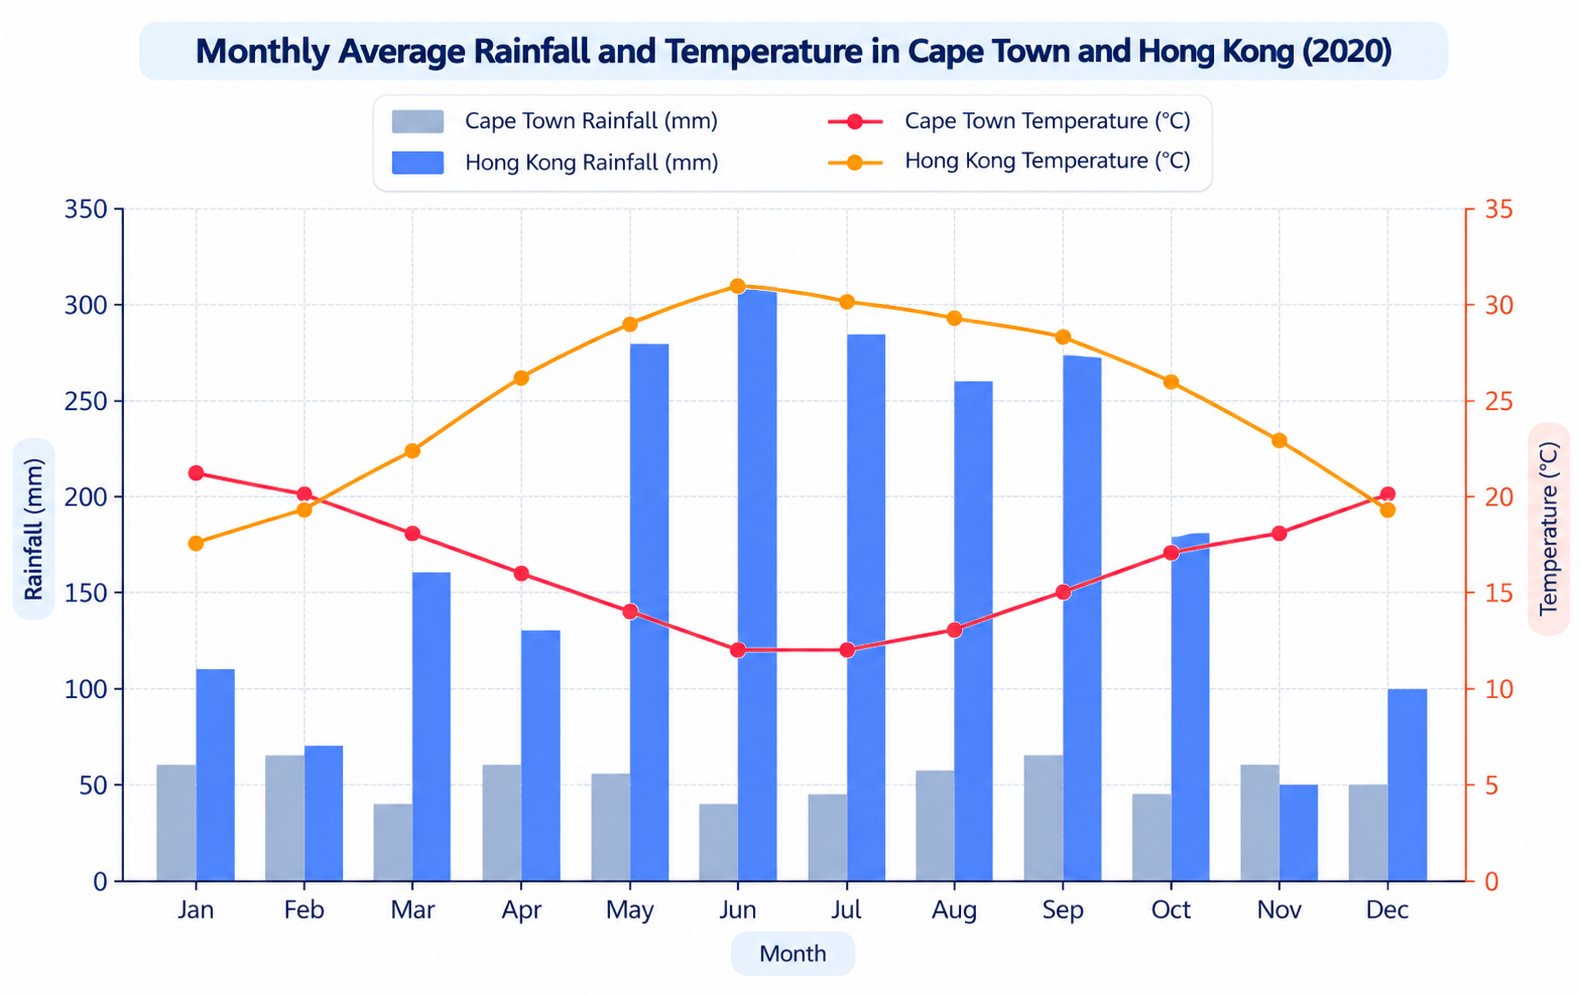
A combined bar and line chart titled 'Monthly Average Rainfall and Temperature in Cape Town and Hong Kong (2020)' showing monthly rainfall in millimetres and average temperatures in degrees Celsius for Cape Town and Hong Kong across all twelve months.
Bar Chart
DI-18

Monthly Average Rainfall and Temperature in Cape Town and Hong Kong (2020)

25s prep40s record
Key Highlight:

"Compares monthly rainfall and average temperatures in Cape Town and Hong Kong throughout 2020."
Not attempted
Start Exercise
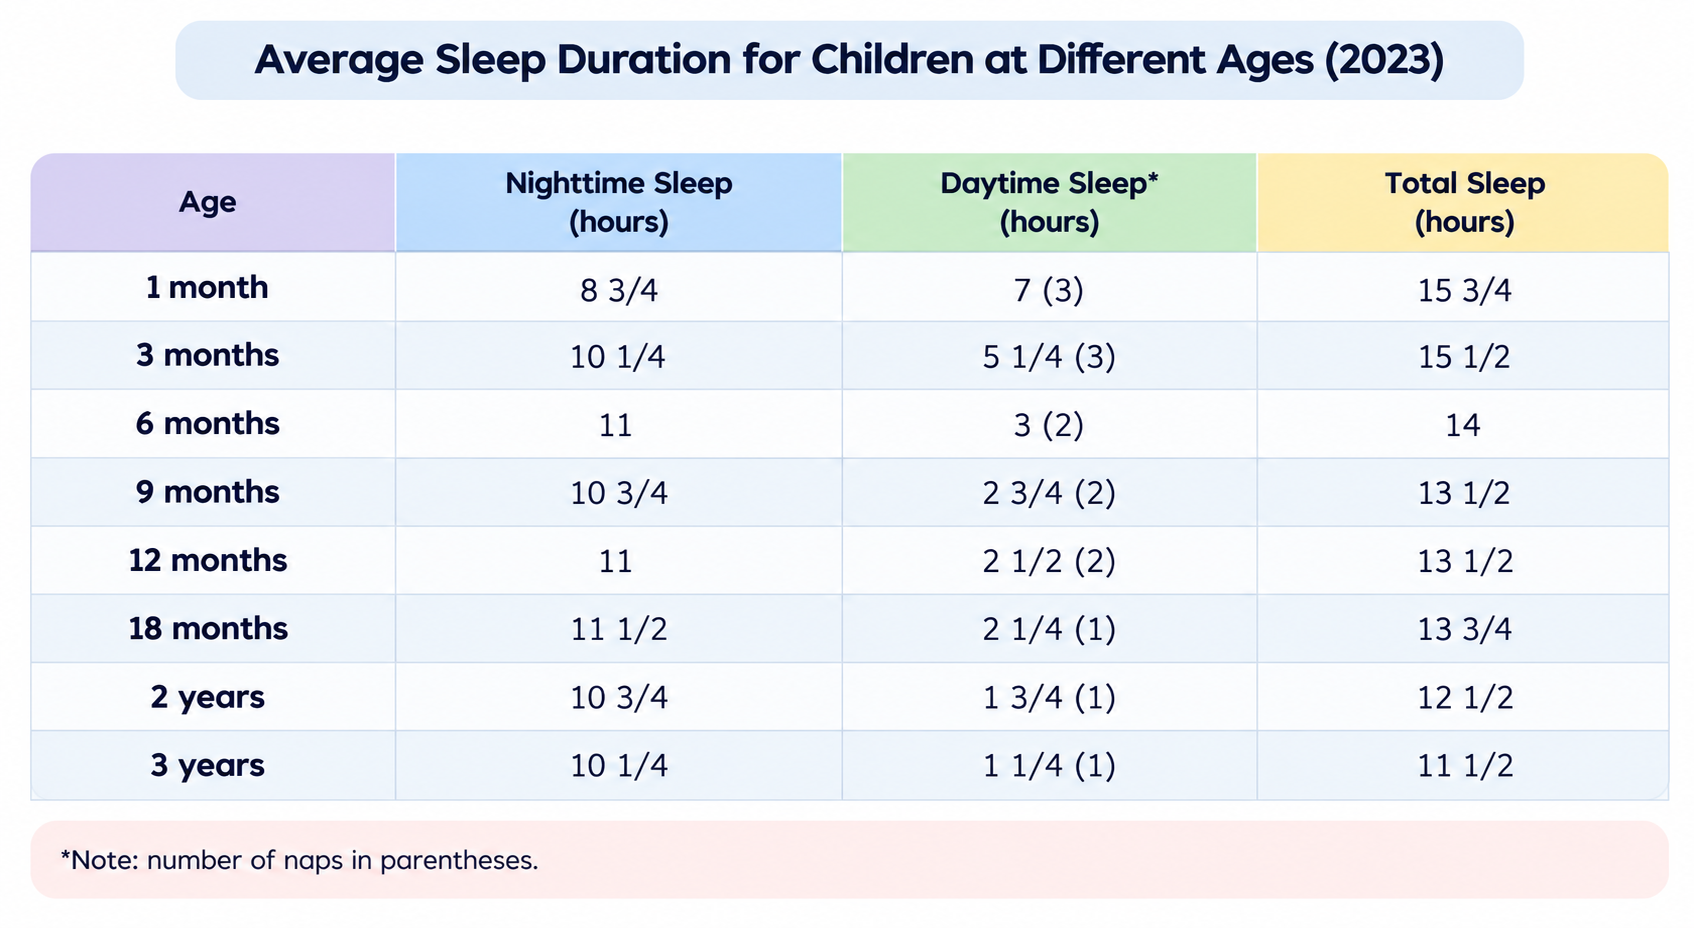
A table titled 'Average Sleep Duration for Children at Different Ages (2023)' comparing nighttime sleep, daytime sleep with number of naps, and total sleep across eight age groups from 1 month to 3 years.
Table
DI-19

Average Sleep Duration for Children at Different Ages (2023)

25s prep40s record
Key Highlight:

"Illustrates average sleep duration among children aged one month to three years."
Not attempted
Start Exercise
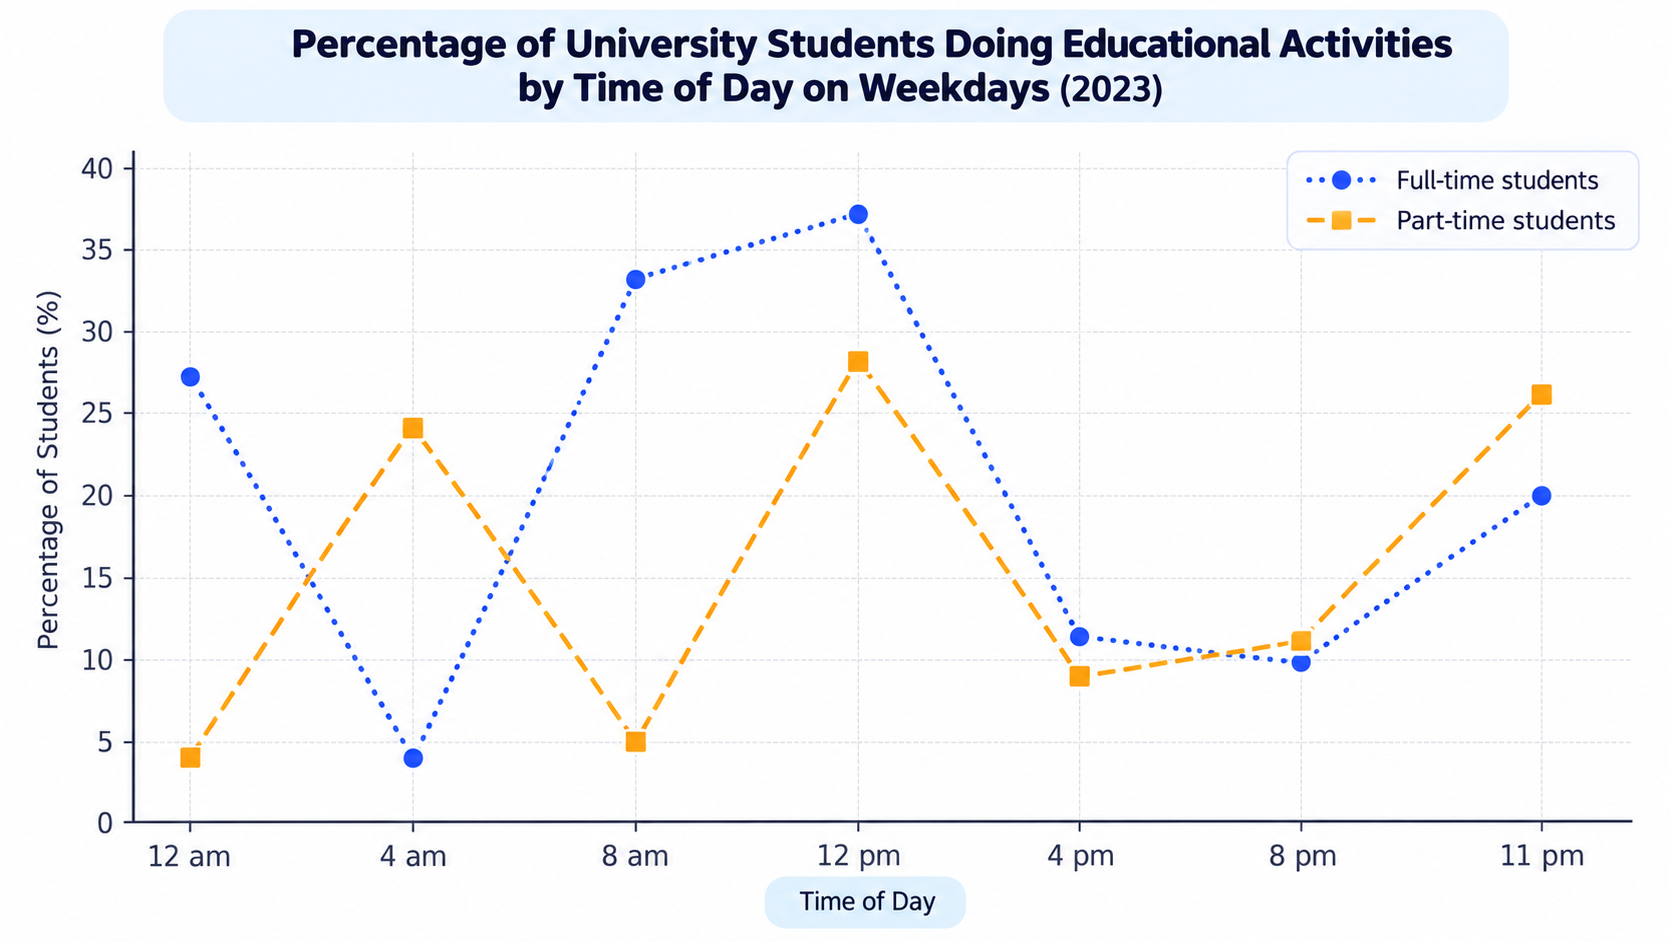
A line graph titled 'Percentage of University Students Doing Educational Activities by Time of Day on Weekdays (2023)' comparing full-time (blue dotted line with circles) and part-time students (orange dashed line with squares) across seven times of day: 12 am, 4 am, 8 am, 12 pm, 4 pm, 8 pm, and 11 pm.
Line Graph
DI-20

Percentage of University Students Doing Educational Activities by Time of Day on Weekdays (2023)

25s prep40s record
Key Highlight:

"Compares percentage of full-time and part-time university students engaged in educational activities on weekdays in 2023."
Not attempted
Start Exercise
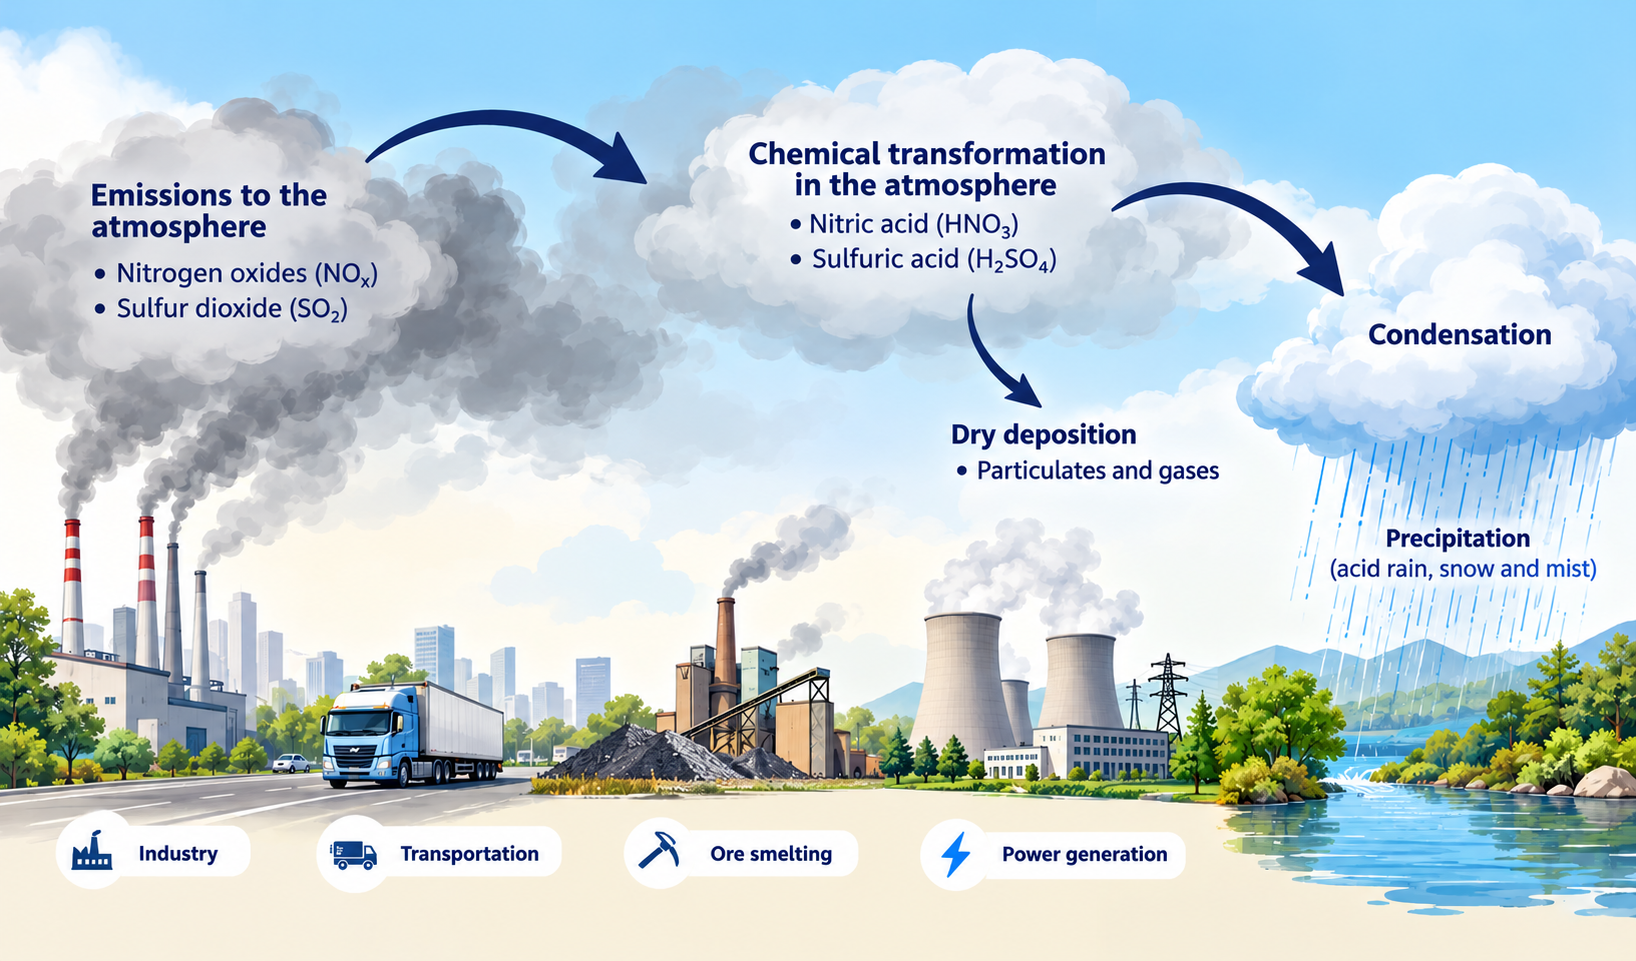
A diagram illustrating the formation of acid rain from emissions (industry, transportation, ore smelting, power generation) releasing nitrogen oxides and sulfur dioxide into the atmosphere, undergoing chemical transformation into nitric and sulfuric acid, and returning via dry deposition and precipitation.
Process Diagram
DI-21

The Formation of Acid Rain

25s prep40s record
Key Highlight:

"Process begins with emissions from industry, transportation, ore smelting, and power generation."
Not attempted
Start Exercise
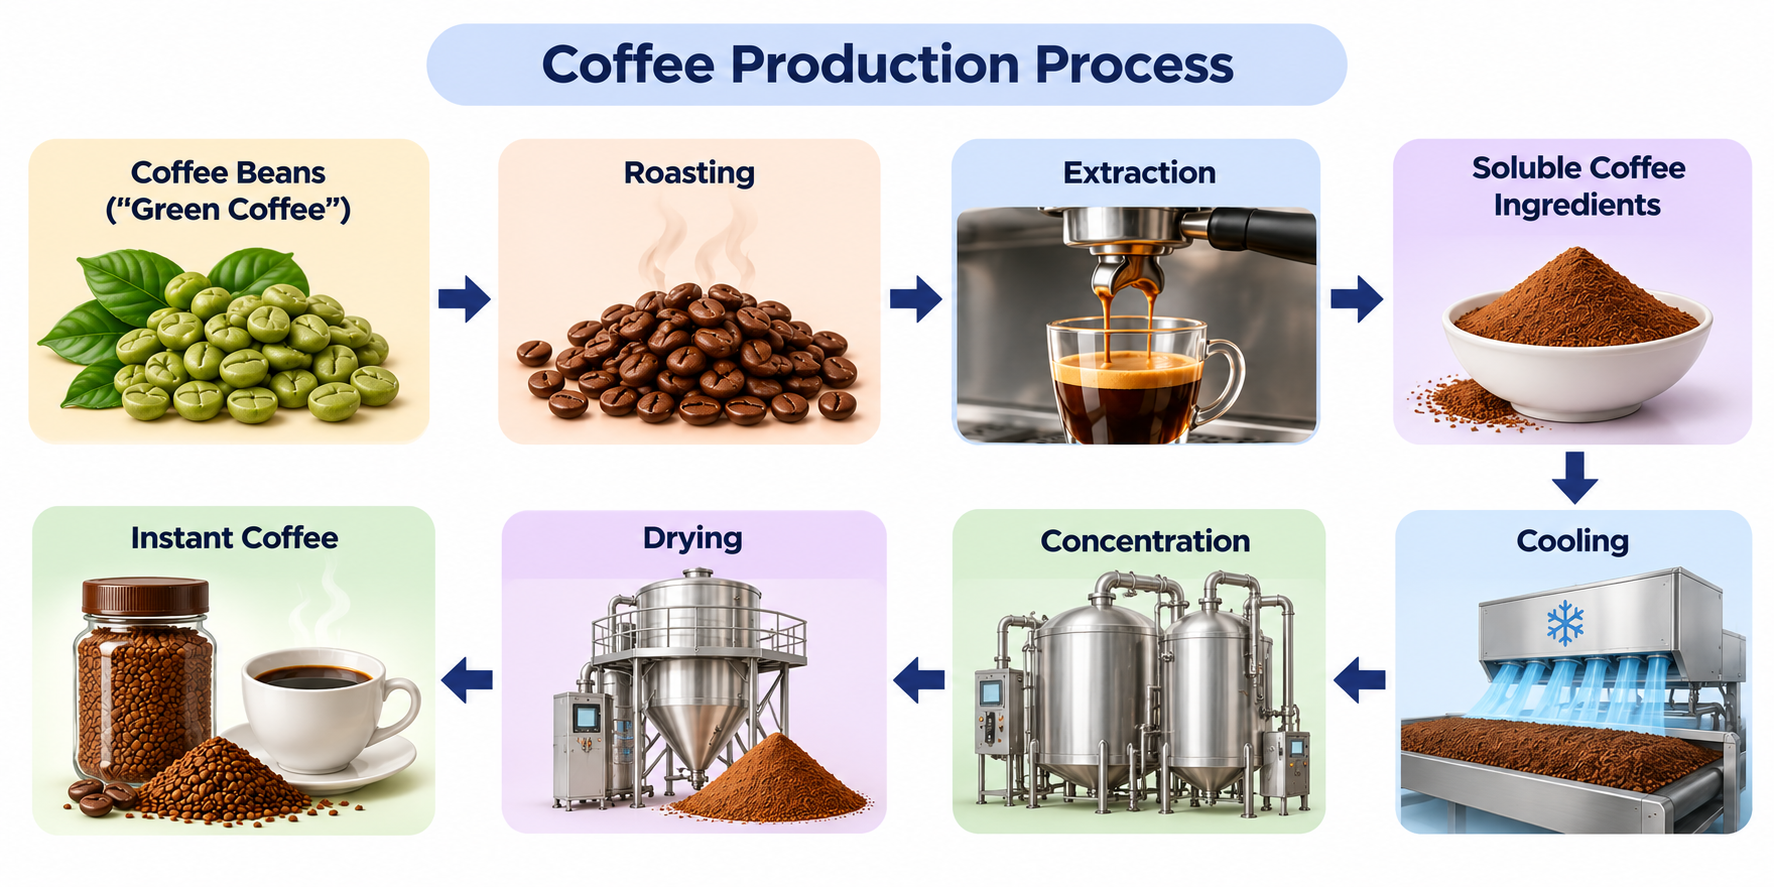
A diagram titled 'Coffee Production Process' illustrating eight sequential steps of instant coffee production: Coffee Beans ('Green Coffee'), Roasting, Extraction, Soluble Coffee Ingredients, Cooling, Concentration, Drying, and Instant Coffee ready in a cup and jar.
Process Diagram
DI-22

Coffee Production Process

25s prep40s record
Key Highlight:

"Process begins with green coffee beans ('Green Coffee')."
Not attempted
Start Exercise
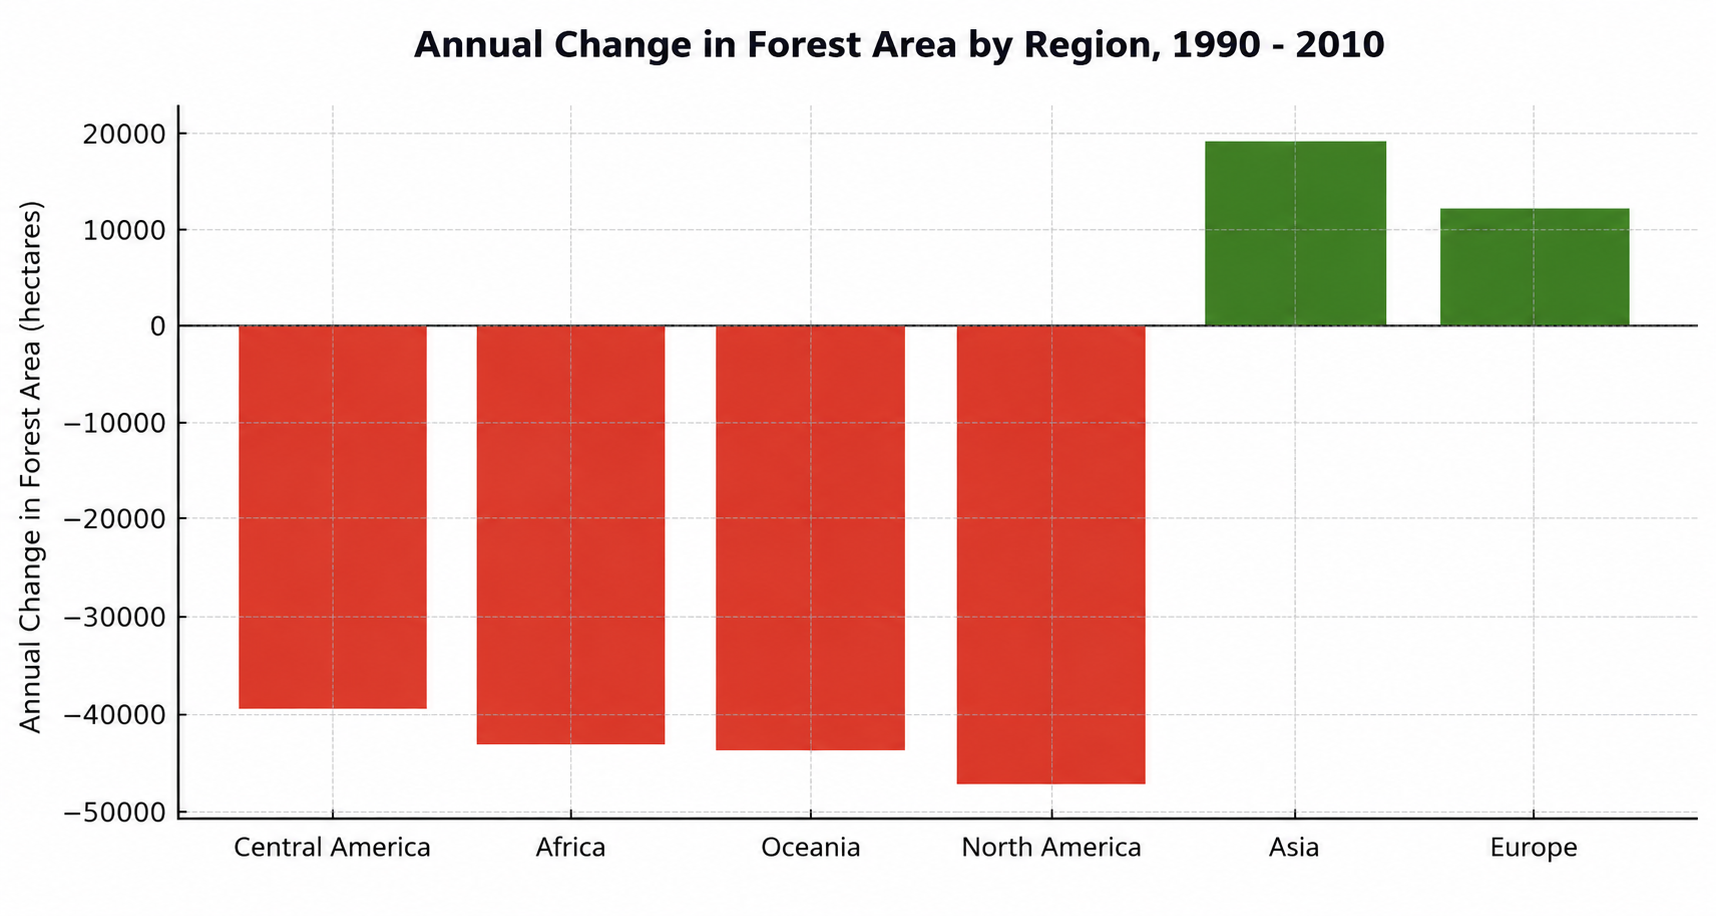
A bar chart titled 'Annual Change in Forest Area by Region, 1990 - 2010' comparing net changes in hectares across Central America, Africa, Oceania, North America (red bars showing losses down to -47,000 ha) versus Asia and Europe (green bars showing gains up to +19,000 ha).
Bar Chart
DI-23

Annual Change in Forest Area by Region (1990–2010)

25s prep40s record
Key Highlight:

"Compares annual changes in forest area across six regions between 1990 and 2010 in hectares."
Not attempted
Start Exercise
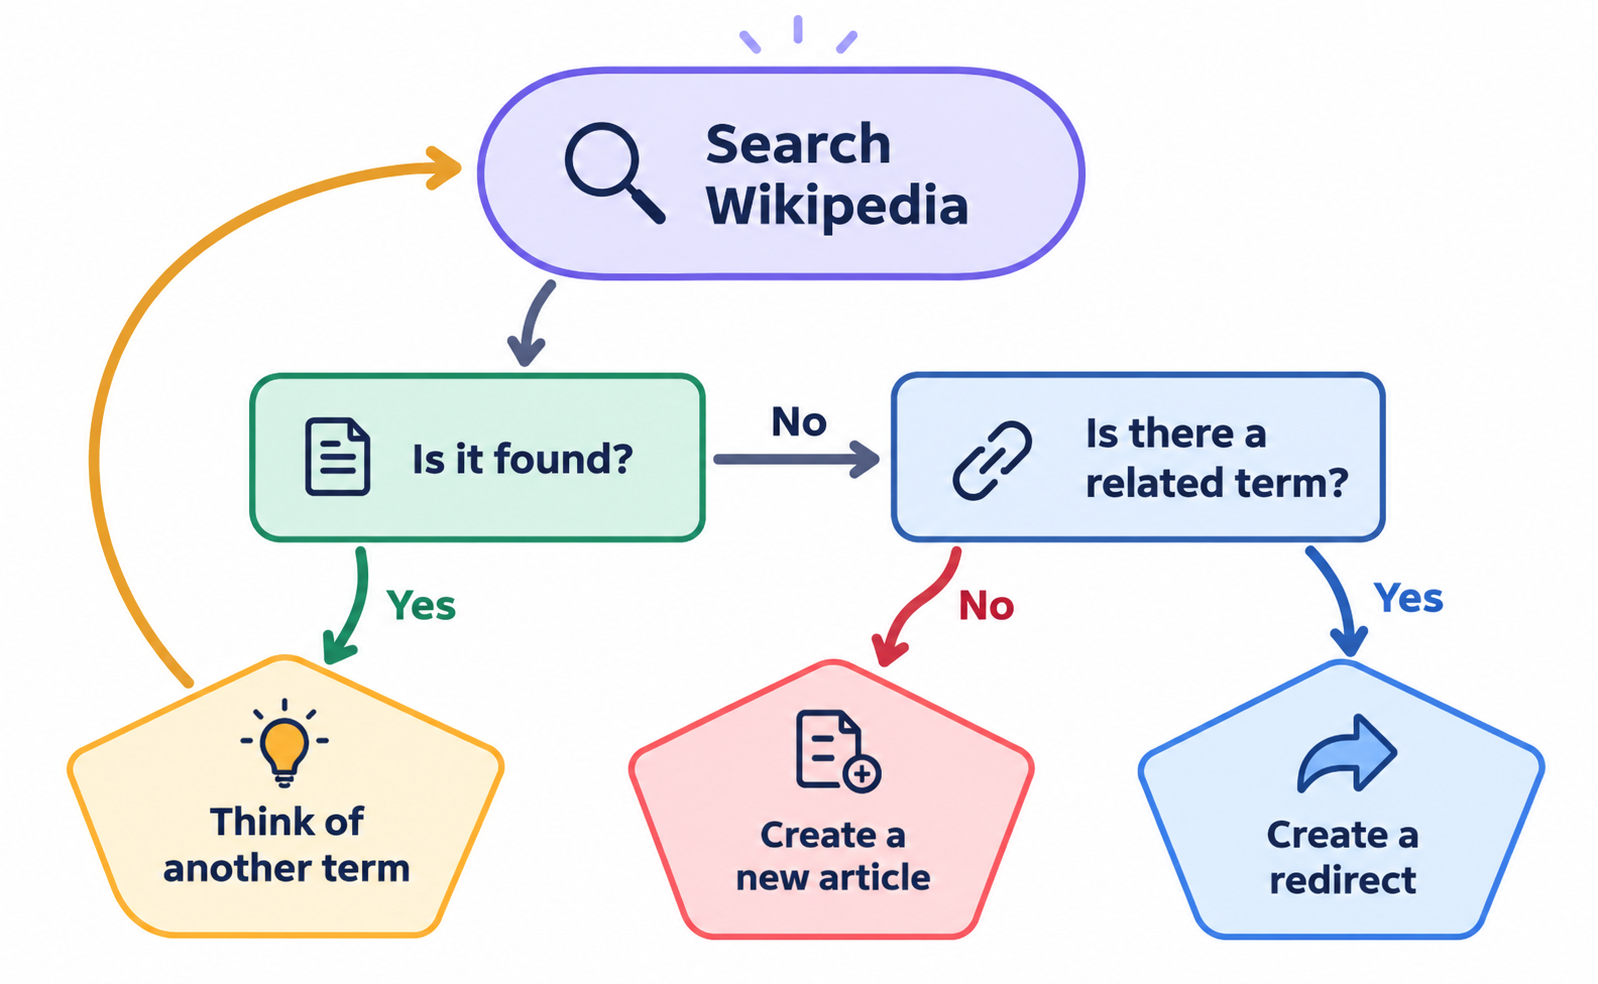
A decision flowchart illustrating the Wikipedia article creation process. Starting with 'Search Wikipedia', the question 'Is it found?' branches to 'Yes' -> 'Think of another term' (with an arrow looping back to search) or 'No' -> 'Is there a related term?'. If 'Yes', 'Create a redirect'; if 'No', 'Create a new article'.
Process Diagram
DI-24

Wikipedia Article Creation Flowchart

25s prep40s record
Key Highlight:

"Process starts with 'Search Wikipedia' to check for existing articles."
Not attempted
Start Exercise
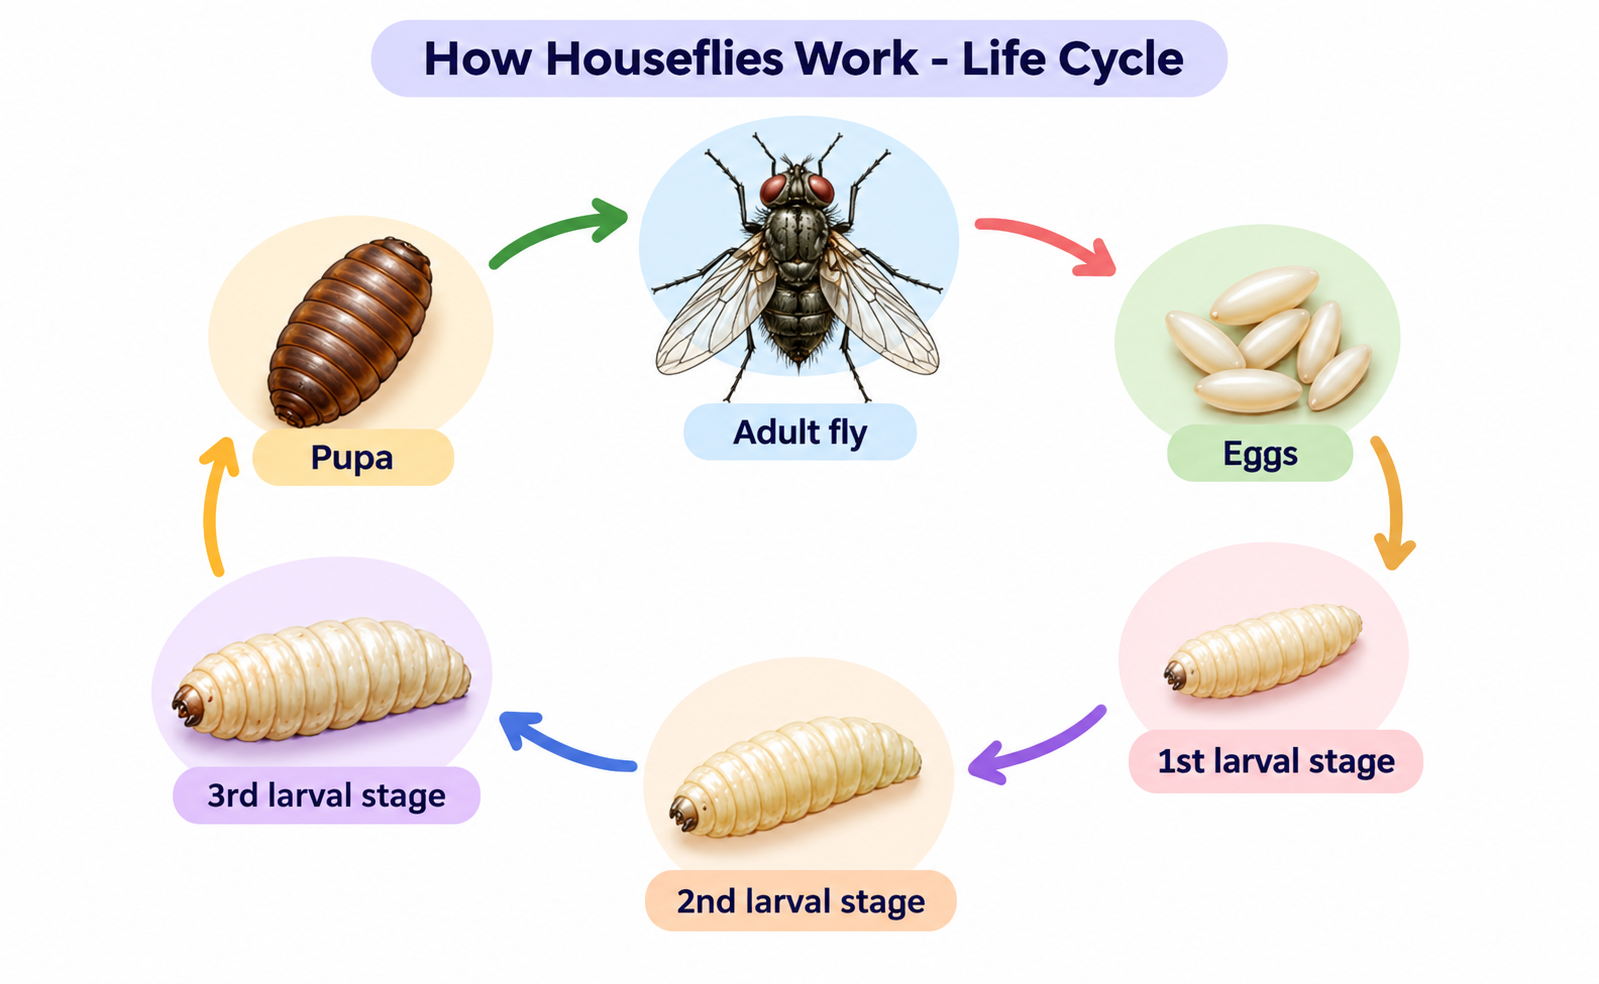
A circular life cycle diagram titled 'How Houseflies Work - Life Cycle' showing six stages in a circular sequence: Adult fly laying Eggs, which hatch into 1st larval stage, growing into 2nd larval stage, 3rd larval stage, turning into a Pupa, and emerging as an Adult fly.
Process Diagram
DI-25

Life Cycle of a Housefly

25s prep40s record
Key Highlight:

"Illustrates the life cycle of a housefly across six distinct developmental stages."

Not attempted
Start Exercise
Average Monthly Rainfall in Vancouver (mm) 168 111 55 0 Millimeters 168 Jan 88 Apr 35 Jul 121 Oct
Bar Chart
DI-26

Average Monthly Rainfall in Vancouver (mm)

25s prep40s record
Key Highlight:

"January is the wettest month at 168 mm."

Not attempted
Start Exercise
Urban vs Rural Population Share in Canada Urban Areas: 82% Rural Communities: 18%
Pie Chart
DI-27

Urban vs Rural Population Share in Canada

25s prep40s record
Key Highlight:

"Over four-fifths of Canadians live in urban areas."

Not attempted
Start Exercise
Public Transit Ridership Recovery Rate (%) 45 2021 62 2022 78 2023 89 2024 Percentage of 2019
Line Graph
DI-28

Public Transit Ridership Recovery Rate (%)

25s prep40s record
Key Highlight:

"Ridership recovered from 45% to 89% of pre-pandemic levels."

Not attempted
Start Exercise
Water Purification & Filtration System 1 Intake 2 Coagulation 3 Sedimentation 4 Filtration
Process Diagram
DI-29

Water Purification & Filtration System

25s prep40s record
Key Highlight:

"Four-stage municipal water purification process."

Not attempted
Start Exercise
Average University Graduate Starting Salary ($k) 100 66 33 0 $ Thousands 48 Arts 62 Business 78 Engineering 71 Health
Bar Chart
DI-30

Average University Graduate Starting Salary ($k)

25s prep40s record
Key Highlight:

"Engineering graduates earn the most at $78k."

Not attempted
Start Exercise
Primary Means of Commuting to Work Personal Car: 65% Public Transit: 20% Walking/Cycling: 10% Remote Work: 5%
Pie Chart
DI-31

Primary Means of Commuting to Work

25s prep40s record
Key Highlight:

"Personal cars dominate commuting at 65%."

Not attempted
Start Exercise
Smartphone Operating System Market Share Android: 71% iOS: 28% Others: 1%
Pie Chart
DI-32

Smartphone Operating System Market Share

25s prep40s record
Key Highlight:

"Android dominates the market with 71% share."

Not attempted
Start Exercise
Renewable Energy Adoption Rate in Canada 52 2015 60 2018 68 2021 75 2024 % of Total Grid
Line Graph
DI-33

Renewable Energy Adoption Rate in Canada

25s prep40s record
Key Highlight:

"Renewable energy rose from 52% to 75% of the grid."

Not attempted
Start Exercise
Coffee Bean Processing & Production 1 Harvesting 2 Pulping 3 Fermentation 4 Drying
Process Diagram
DI-34

Coffee Bean Processing & Production

25s prep40s record
Key Highlight:

"Four-stage coffee bean processing sequence."

Not attempted
Start Exercise
Average Temperature by Canadian City (°C, Summer) 100 66 33 0 Degrees Celsius 22 Vancouver 27 Toronto 26 Montreal 19 Calgary
Bar Chart
DI-35

Average Temperature by Canadian City (°C, Summer)

25s prep40s record
Key Highlight:

"Toronto has the warmest summer average at 27°C."

Not attempted
Start Exercise
Household Waste Composition by Type Organic: 34% Paper & Card: 25% Plastic: 18% Glass & Metal: 13% Other: 10%
Pie Chart
DI-36

Household Waste Composition by Type

25s prep40s record
Key Highlight:

"Organic waste is the largest category at 34%."

Not attempted
Start Exercise
Internet Users Worldwide Growth (Billions) 2 2010 2.9 2014 3.9 2018 4.9 2022 Billions of Users
Line Graph
DI-37

Internet Users Worldwide Growth (Billions)

25s prep40s record
Key Highlight:

"Internet users grew from 2.0 to 4.9 billion."

Not attempted
Start Exercise
Cement Manufacturing Process 1 Quarrying 2 Crushing 3 Grinding 4 Heating 5 Packaging
Process Diagram
DI-38

Cement Manufacturing Process

25s prep40s record
Key Highlight:

"Five-stage cement production process."

Not attempted
Start Exercise
Average Monthly Rent by Neighborhood ($/month) 2100 1386 693 0 CAD per month 2100 Downtown 1650 Midtown 1350 Suburb A 1100 Suburb B
Bar Chart
DI-39

Average Monthly Rent by Neighborhood ($/month)

25s prep40s record
Key Highlight:

"Downtown rent is the highest at $2,100/month."

Not attempted
Start Exercise
Global Energy Carbon Footprint by Source Coal: 42% Natural Gas: 26% Oil: 22% Renewables: 10%
Pie Chart
DI-40

Global Energy Carbon Footprint by Source

25s prep40s record
Key Highlight:

"Coal is the largest carbon emitter at 42%."

Not attempted
Start Exercise
Electric Vehicle Sales Growth (Millions of Units) 2.2 2019 3.2 2020 6.6 2021 10.5 2022 14.1 2023 Millions of Units
Line Graph
DI-41

Electric Vehicle Sales Growth (Millions of Units)

25s prep40s record
Key Highlight:

"EV sales surged from 2.2M to 14.1M units."

Not attempted
Start Exercise
Desalination Water Treatment Process 1 Intake 2 Pre-treatment 3 Reverse Osmosis 4 Remineralization
Process Diagram
DI-42

Desalination Water Treatment Process

25s prep40s record
Key Highlight:

"Four-stage desalination process."

Not attempted
Start Exercise
Average Sleep Duration by Age Group (hours/night) 100 66 33 0 Hours per night 8.5 Teens 7.2 20s 6.8 30s 6.5 40s 6.3 50s+
Bar Chart
DI-43

Average Sleep Duration by Age Group (hours/night)

25s prep40s record
Key Highlight:

"Teens sleep the most at 8.5 hours per night."

Not attempted
Start Exercise
Streaming Service Market Share Netflix: 35% Amazon Prime: 22% Disney+: 18% Others: 25%
Pie Chart
DI-44

Streaming Service Market Share

25s prep40s record
Key Highlight:

"Netflix leads the streaming market at 35%."

Not attempted
Start Exercise
Remote Work Adoption Rate (%) 7 2019 42 2020 35 2021 28 2022 22 2023 Percentage of Workforce
Line Graph
DI-45

Remote Work Adoption Rate (%)

25s prep40s record
Key Highlight:

"Remote work spiked to 42% in 2020."

Not attempted
Start Exercise
Olive Oil Production Process 1 Harvesting 2 Washing 3 Crushing 4 Malaxation 5 Centrifugation
Process Diagram
DI-46

Olive Oil Production Process

25s prep40s record
Key Highlight:

"Five-stage olive oil extraction process."

Not attempted
Start Exercise
Tourism Revenue by Province ($ Billions) 100 66 33 0 Billion CAD 32 Ontario 21 BC 18 Quebec 12 Alberta
Bar Chart
DI-47

Tourism Revenue by Province ($ Billions)

25s prep40s record
Key Highlight:

"Ontario leads tourism revenue at $32B."

Not attempted
Start Exercise
Global Coffee Production by Region South America: 45% Asia: 28% Africa: 17% Central America: 10%
Pie Chart
DI-48

Global Coffee Production by Region

25s prep40s record
Key Highlight:

"South America dominates coffee production at 45%."

Not attempted
Start Exercise
Average Daily Commute Time by City (minutes) 100 66 33 0 Minutes 52 Toronto 44 Montreal 38 Vancouver 29 Calgary 24 Ottawa
Bar Chart
DI-49

Average Daily Commute Time by City (minutes)

25s prep40s record
Key Highlight:

"Toronto has the longest commute at 52 minutes."

Not attempted
Start Exercise
Canadian Federal Budget Allocation Healthcare: 36% Education: 22% Infrastructure: 18% Defense: 15% Other: 9%
Pie Chart
DI-50

Canadian Federal Budget Allocation

25s prep40s record
Key Highlight:

"Healthcare is the largest budget item at 36%."

Not attempted
Start Exercise