Bar Chart
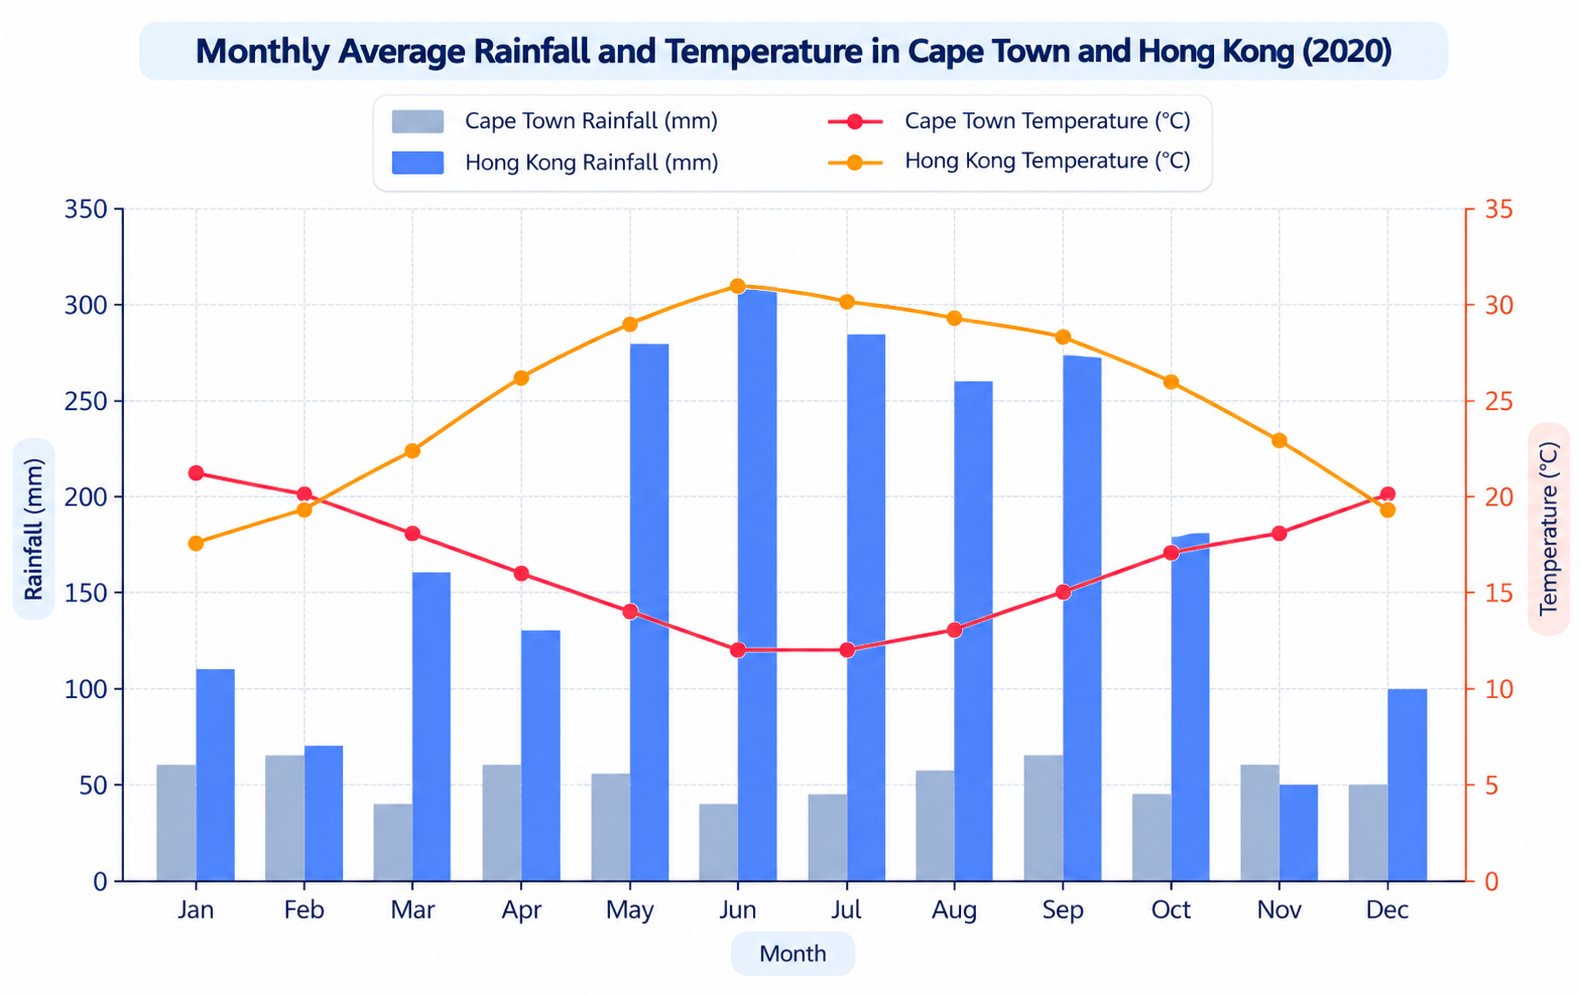
Monthly Average Rainfall and Temperature in Cape Town and Hong Kong (2020)
Prep: 25s
Record: 40s
Look at the image below. In 25 seconds, please speak into the microphone and describe in detail what the image is showing. You will have 40 seconds to give your response.
Sample Answer & Key Features
Review official key features and a band-9 reference response
Key Points to Include in Your Description:
- 1Compares monthly rainfall and average temperatures in Cape Town and Hong Kong throughout 2020.
- 2Hong Kong experienced significantly higher rainfall, peaking at approximately 310 millimetres in June.
- 3Cape Town's rainfall remained relatively stable, generally between 40 and 65 millimetres.
- 4Hong Kong reached its highest temperature at 31 degrees Celsius in June.
- 5Cape Town recorded its lowest temperatures of around 12 degrees during June and July.
- 6Overall, the two cities displayed contrasting seasonal patterns, with Hong Kong experiencing warmer, wetter summers.