Bar Chart
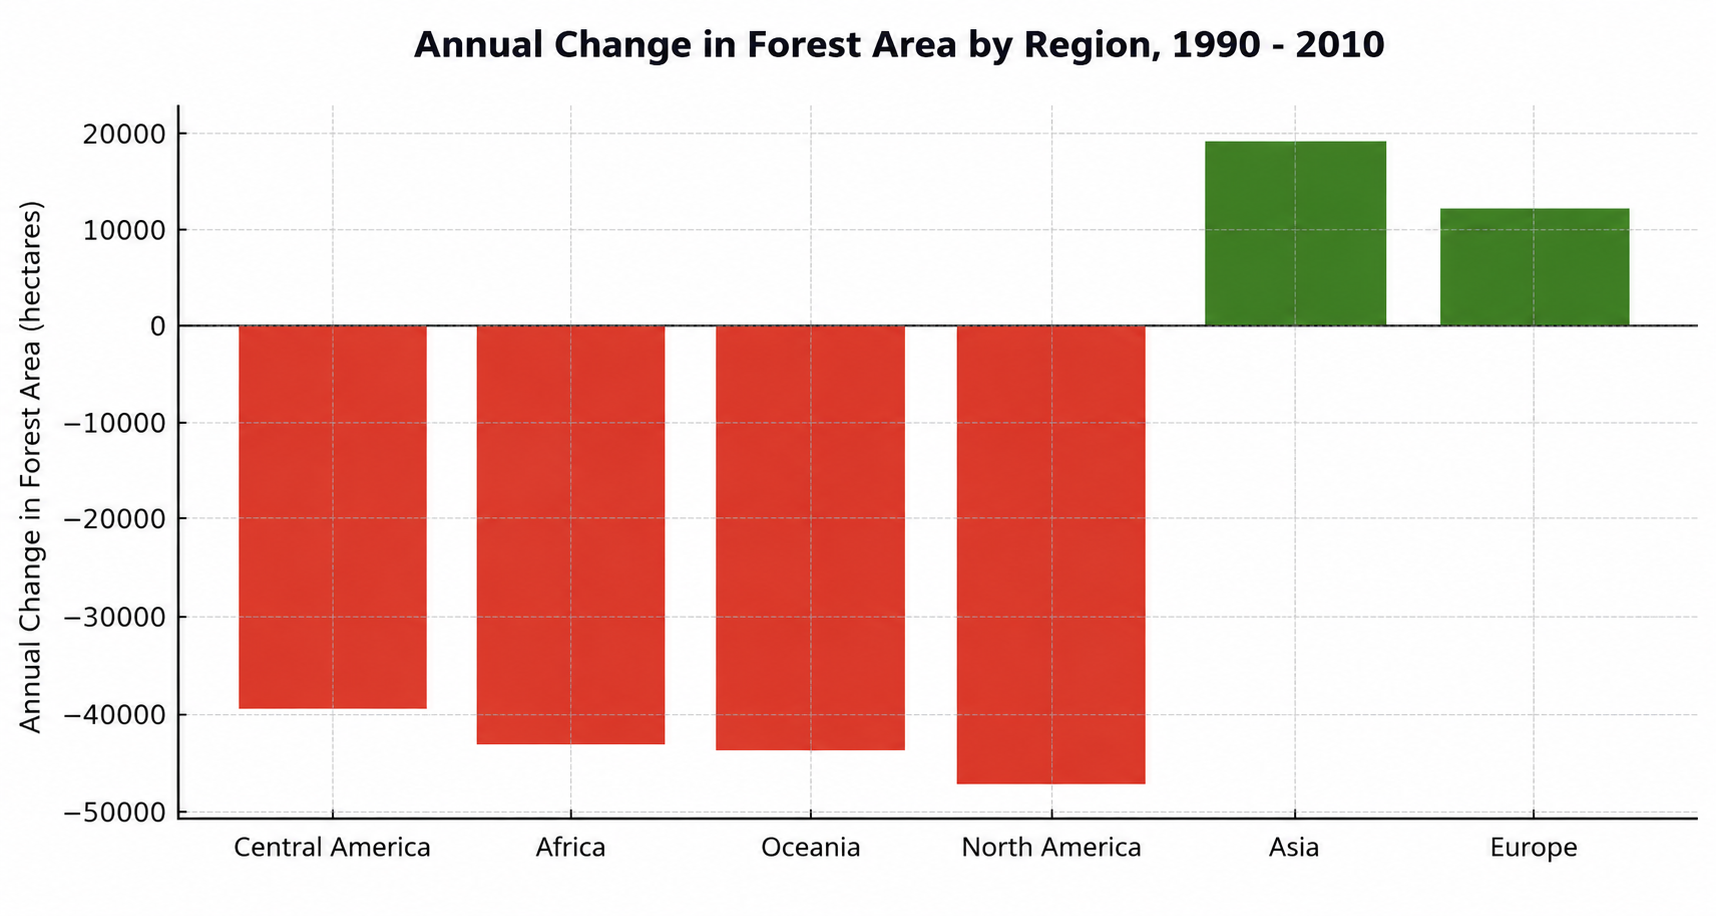
Annual Change in Forest Area by Region (1990–2010)
Prep: 25s
Record: 40s
Look at the image below. In 25 seconds, please speak into the microphone and describe in detail what the image is showing. You will have 40 seconds to give your response.
Sample Answer & Key Features
Review official key features and a band-9 reference response
Key Points to Include in Your Description:
- 1Compares annual changes in forest area across six regions between 1990 and 2010 in hectares.
- 2North America suffered the largest forest loss, dropping by approximately 47,000 hectares annually.
- 3Oceania and Africa both recorded sharp declines exceeding 40,000 hectares each.
- 4Central America also suffered substantial decline of nearly 40,000 hectares.
- 5Asia showed the largest increase, gaining roughly 19,000 hectares.
- 6Europe followed with an increase of around 12,000 hectares.
- 7Overall regional losses significantly exceeded gains across the surveyed territories.