Table
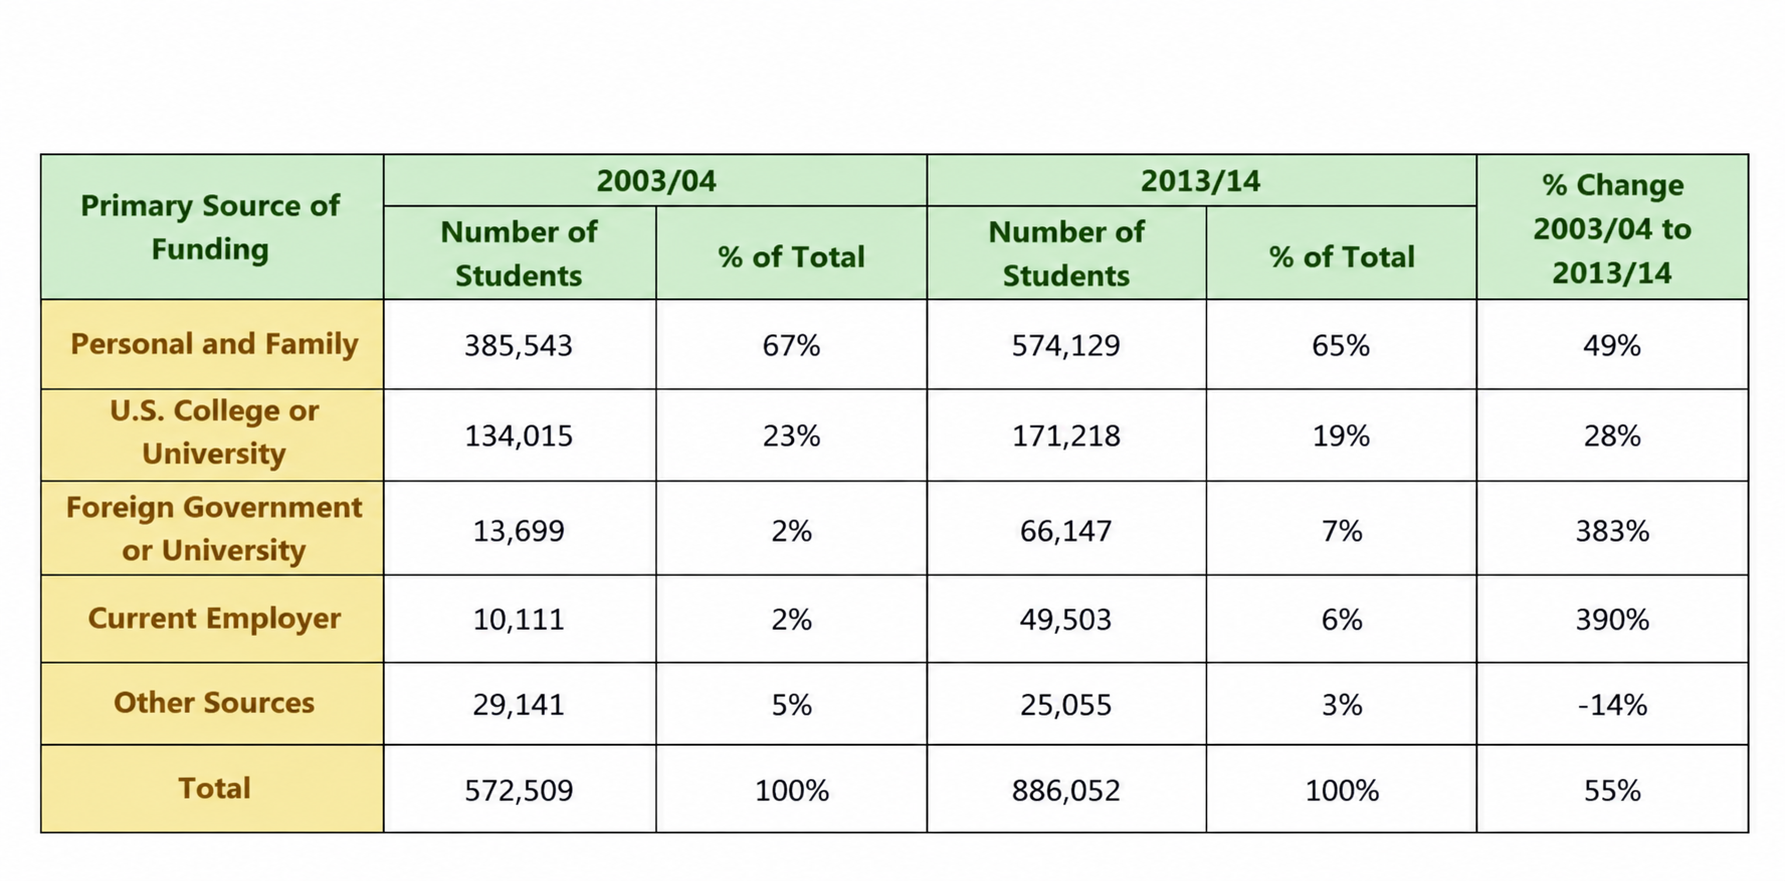
Students' Primary Sources of Funding (2003/04 vs 2013/14)
Prep: 25s
Record: 40s
Look at the image below. In 25 seconds, please speak into the microphone and describe in detail what the image is showing. You will have 40 seconds to give your response.
Sample Answer & Key Features
Review official key features and a band-9 reference response
Key Points to Include in Your Description:
- 1Personal and family funding remained dominant, though slipping from 67% to 65% of the total.
- 2U.S. colleges and universities ranked second in both academic years (23% to 19%).
- 3Foreign government/university (+383%) and employer-funded (+390%) students each surged by over 300%.
- 4Total student count expanded substantially by 55%, from 572,509 to 886,052.
- 5Other sources was the sole funding category to experience a decline (-14%).