Line Graph
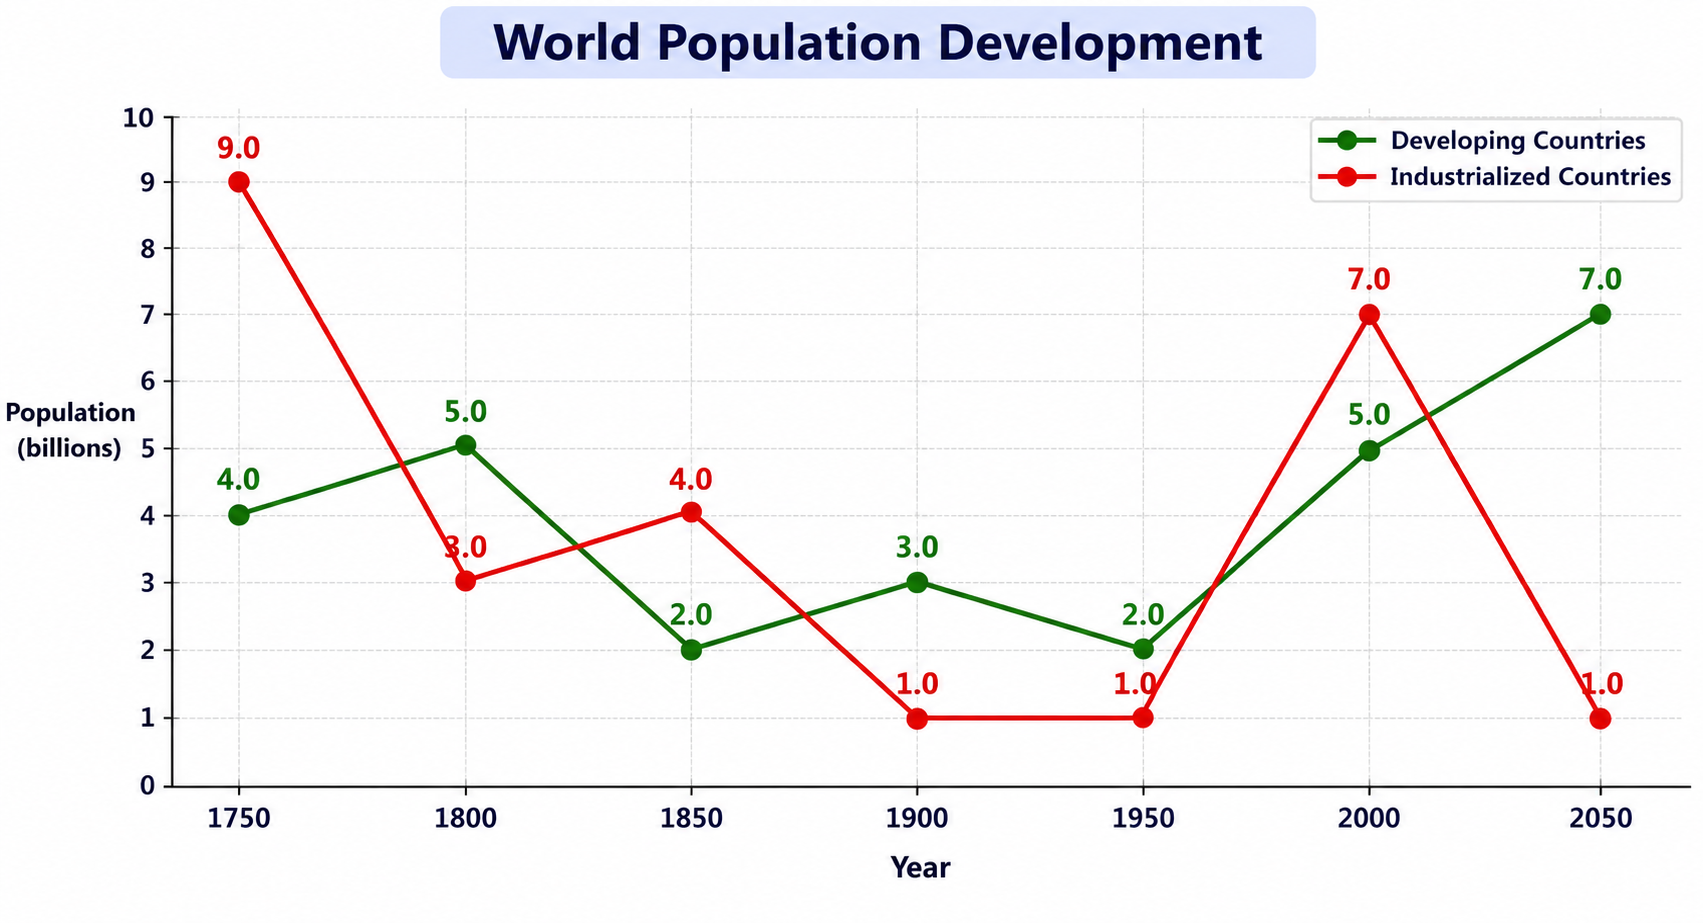
World Population Development (1750–2050)
Prep: 25s
Record: 40s
Look at the image below. In 25 seconds, please speak into the microphone and describe in detail what the image is showing. You will have 40 seconds to give your response.
Sample Answer & Key Features
Review official key features and a band-9 reference response
Key Points to Include in Your Description:
- 1Compares population figures for developing and industrialized countries from 1750 to 2050 in billions.
- 2Industrialized countries show sharper swings, falling from 9 billion initially to 1 billion in 1950.
- 3Industrialized countries rebound to 7 billion in 2000 before plunging back to 1 billion in 2050.
- 4Developing countries rise from 2 billion in 1950 to 7 billion by 2050.
- 5Final contrast in 2050: developing countries reach 7 billion while industrialized countries drop to 1 billion.