Line Graph
Environmental Trends: Temperature, CO2 & Dust Concentration
Prep: 25s
Record: 40s
Look at the image below. In 25 seconds, please speak into the microphone and describe in detail what the image is showing. You will have 40 seconds to give your response.
Sample Answer & Key Features
Review official key features and a band-9 reference response
Key Points to Include in Your Description:
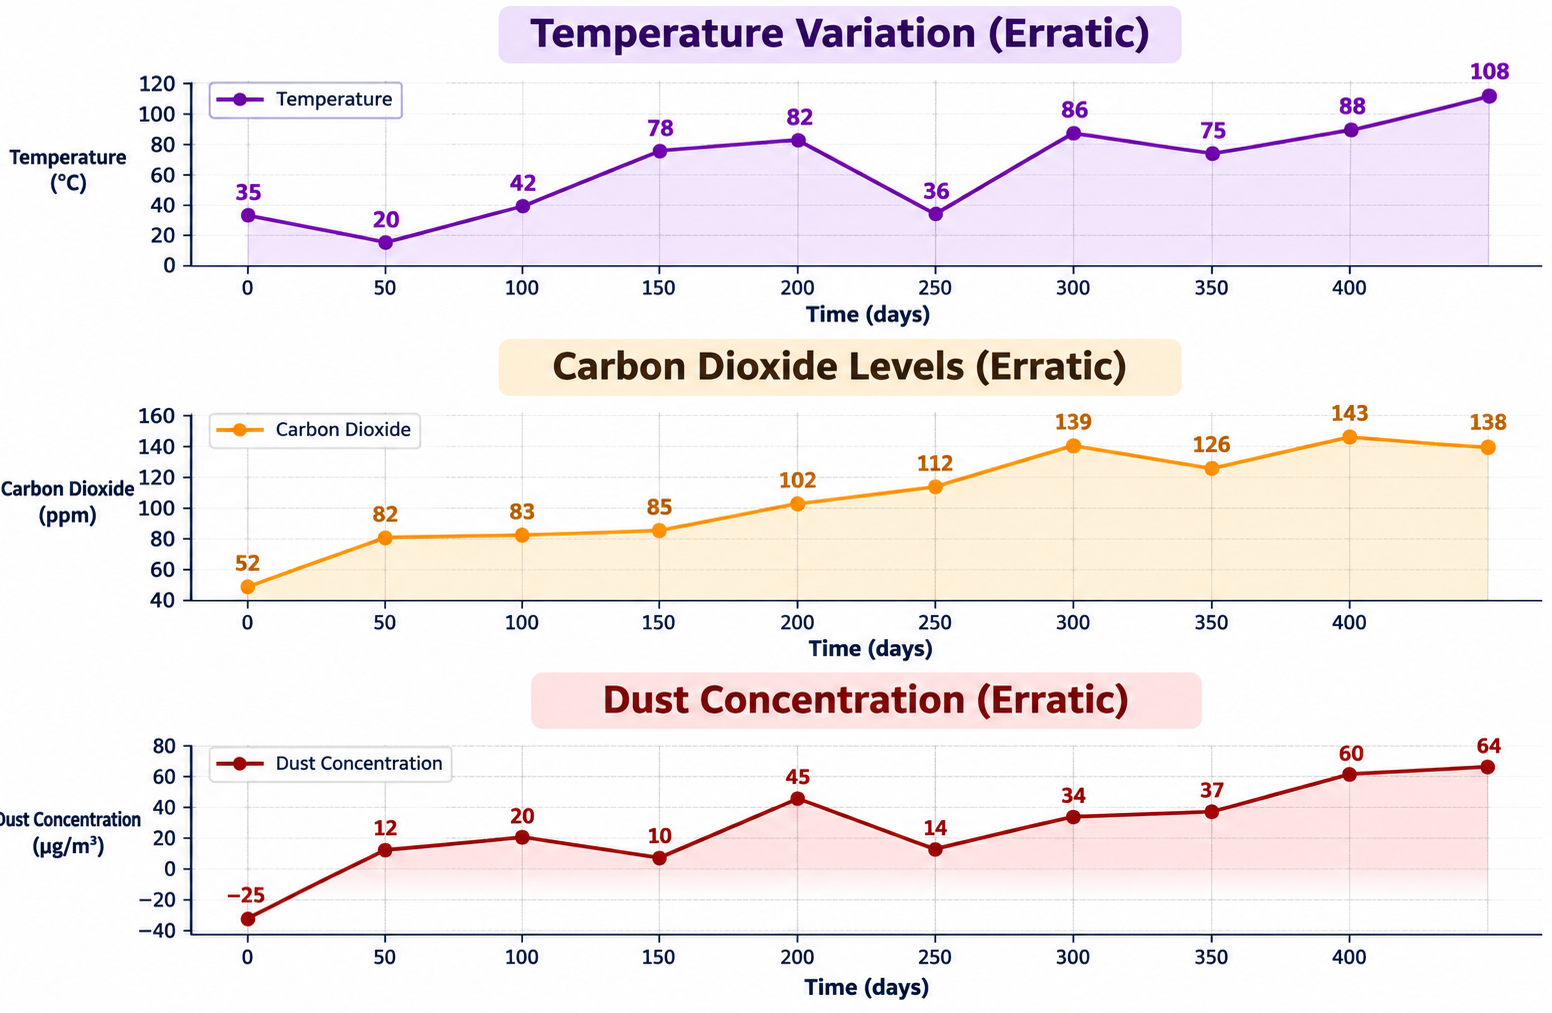
- 1Three stacked line charts tracking temperature, carbon dioxide levels, and dust concentration over a 450-day period.
- 2All three metrics exhibit an overall upward trend despite noticeable periodic fluctuations.
- 3Temperature rises irregularly from 35°C to a peak of 108°C, with a dip to 36°C at day 250.
- 4Carbon dioxide climbs steadily from 52 ppm to 143 ppm at day 400 before settling at 138 ppm.
- 5Dust concentration increases from -25 µg/m³ to 64 µg/m³, with a shared dip with temperature around day 250 while CO2 continued climbing.